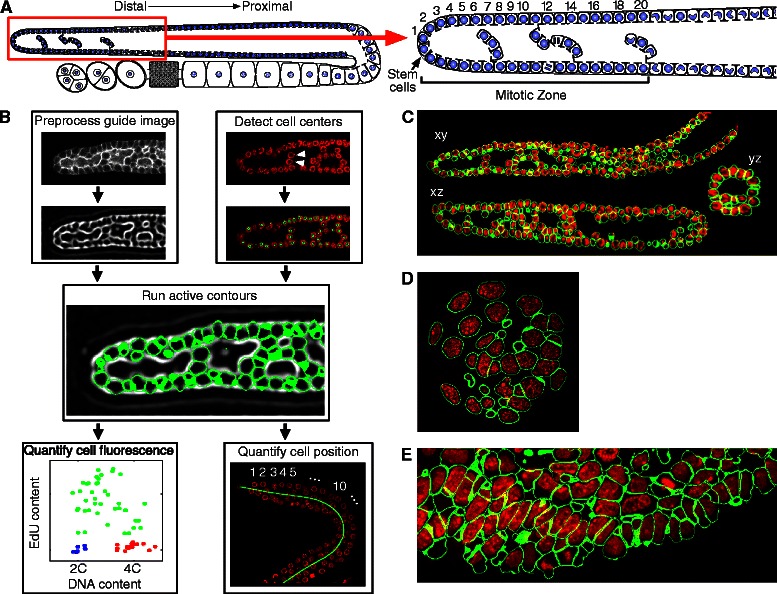
Fig. 1.

Overview of Parismi image analysis pipeline. a Diagram of the C. elegans gonadal arm (left) with an enlarged view of the MZ (right). Cell rows are numbered with row one at the distal most end where the stem cells reside. b Application of Parismi to images of C. elegans gonadal arms. The membrane image is preprocessed using a principal curvature approach to produce a guide image. Cell centers are identified manually or using an SVM classifier, and act as seeds for active contours that are run against the guide image. Position and fluorescence contents are quantified using segmentation masks derived from the active contours. Arrowheads give an example of cells whose DNA staining gap in the nucleus center is larger than the gap between each cell. c-e Example 3D segmentations of a C. elegans gonadal arm (c), a pre-implantation mouse embryo (d), and mouse olfactory epithelium (e); red: DNA channel; green: segmentation mask boundary
