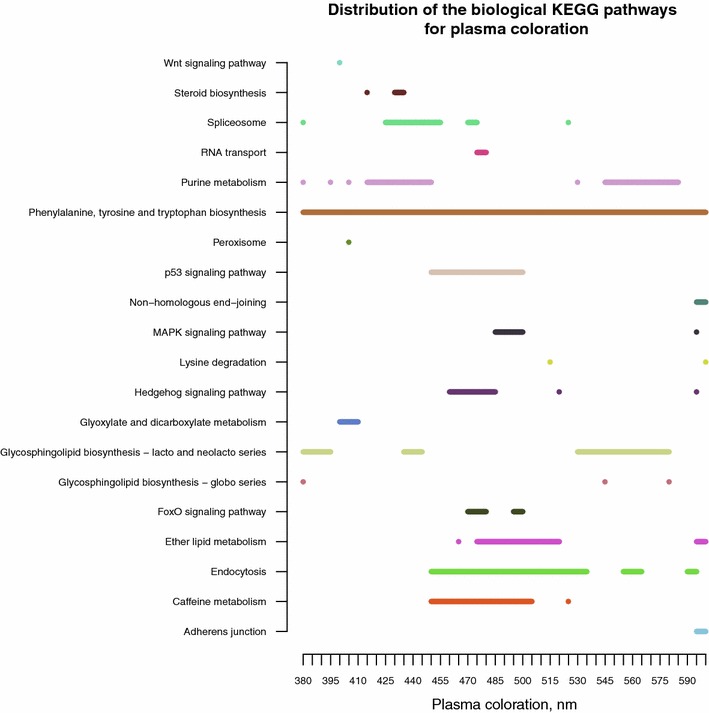
Fig. 5.

Distribution of the biological pathways that were significantly enriched with genes in genomic regions associated with plasma coloration (PC). Distribution of the biological pathways significantly (P < 0.05) that were enriched with genes in genomic regions associated with plasma measurement for all 45 wavelengths. Coloration of blood plasma was measured as the level of absorbance for 45 wavelengths in the range from 380 to 600 nm. This figure illustrates significant KEGG pathways for PC measurements in the range from 380 to 600 nm
