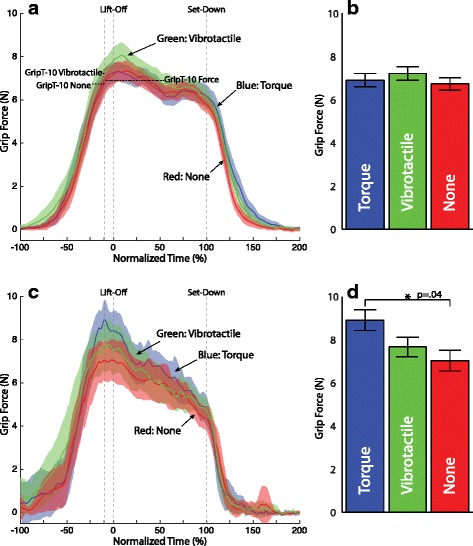
Fig. 8.

Grip force trajectory by feedback condition for the heavy object. a Non-amputee c Amputee participant. Solid lines represent the mean of all successful (no-slip) trials in the first two block (trials 1–72). Shading represents the 95 % confidence intervals of the mean. Blue traces represent joint torque feedback, green traces represent vibrotactile feedback, and red traces represent no feedback. The mean grip force for each condition with the heavy weight just before lift-off GripT-10 is shown in the accompanying bar plots: b non-amputee, d Amputee participant. Error bars represent 1 standard error
