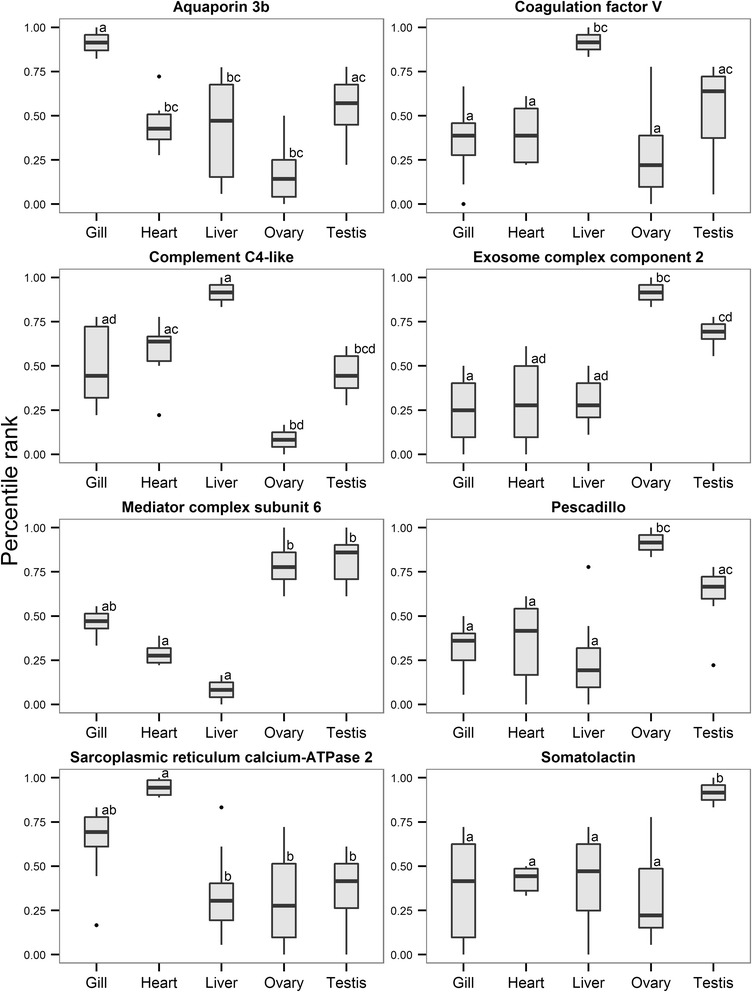
Fig. 6.

Combined expression profiles of target genes belonging to six largest T. thynnus tissue clusters. The profiles were derived by combining qPCR and microarray data for specific genes using their respective percentile ranks. Nonparametric Kruskal-Wallis test was used to determine statistical significance of the differences between tissues. Letter codes denote statistical significance at p< 0.05
