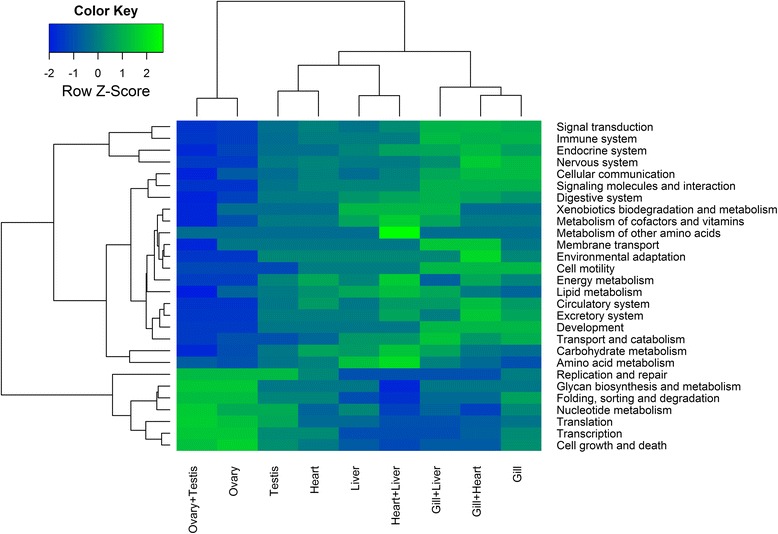
Fig. 7.

Heatmap showing contrasts between T. thynnus tissues and their combinations based on KEGG functional groups. Two-dimensional hierarchical clustering was performed on the difference between the counts of up- and down- regulated pathways within each KEGG functional category after GAGE gene set enrichment analyses. The analyses was conducted for each selected tissue and their combinations against other samples. Each tissue and their most informative pair-wise combinations are shown
