
Figure 3. a) Effect EER treatment on serum insulin levels in response to an oral glucose challenge in HFD-fed and low dose STZ-induced type 2 diabetes in Wistar rats, b) Effect EER treatment on area under curve (AUC 0-120 min) of serum insulin levels in response to an oral glucose challenge in HFD-fed and low dose STZ-induced type 2 diabetes in Wistar rats.
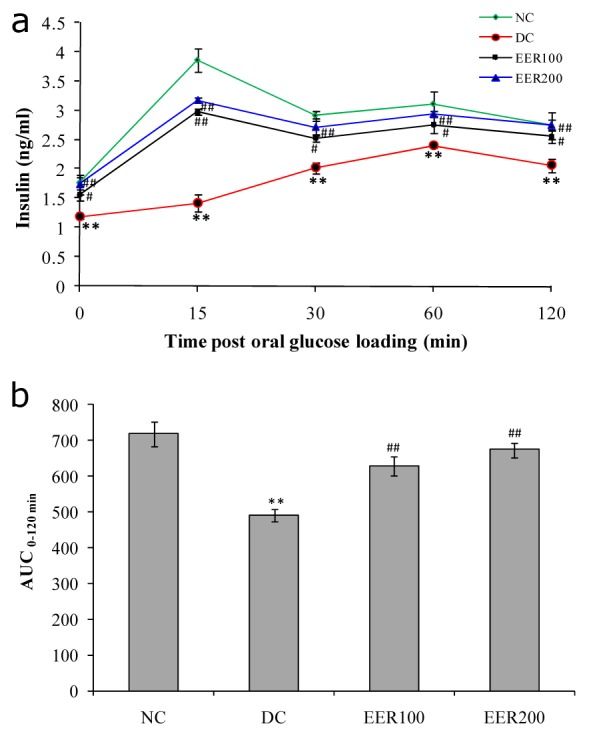
All values were expressed as mean SEM, (n=10); *P< 0.05, **P< 0.01 as compared to NC group; #P<0.05, ##P< 0.01 as compared to DC group