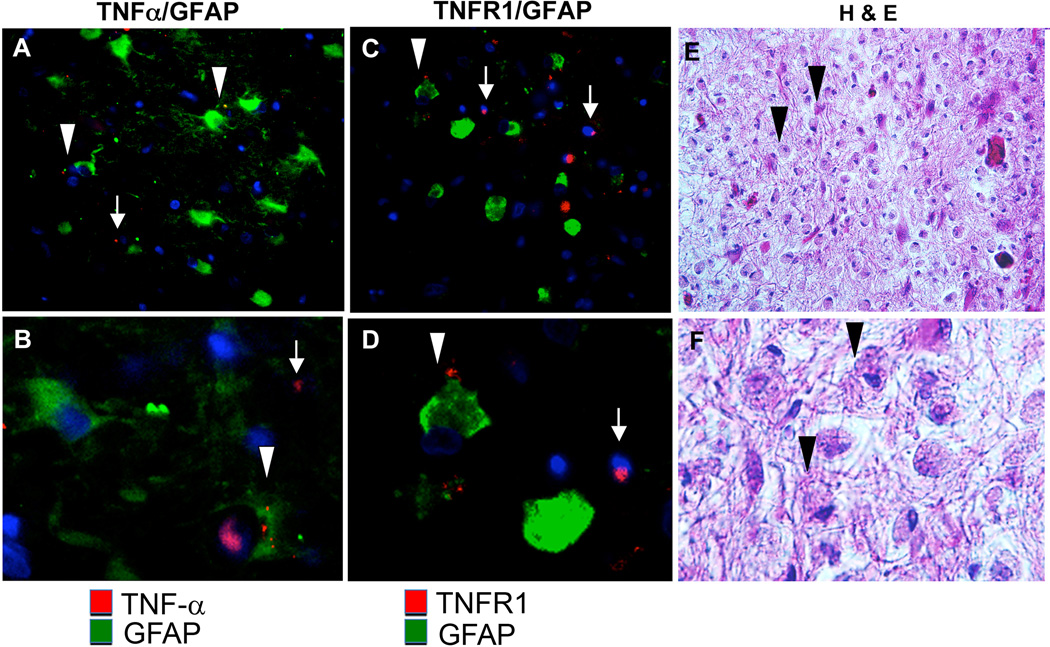
Figure 2. Immunohistochemical analysis of expression of TNF-α and TNFR1 in HIV-1/PML brain tissues.
Double immunofluorescence labeling of HIV-1/PML with (A, B) anti-TNF-α (red) and anti-GFAP (green), (C, D) anti-TNFR1 (red) and anti-GFAP (green). (A–D) Arrowheads indicate astrocyte immunoreactivity with TNR-α or TNFR1, arrows indicate GFAP negative, TNFR1 and TNF-α positive cells. (E, F) Hematoxylin and Eosin (H&E) stain, arrowheads indicate nuclear inclusions in bizarre astrocytes. (A, C, E) 400× magnification, (B, D, F) 400× magnification enlarged to show detail.

