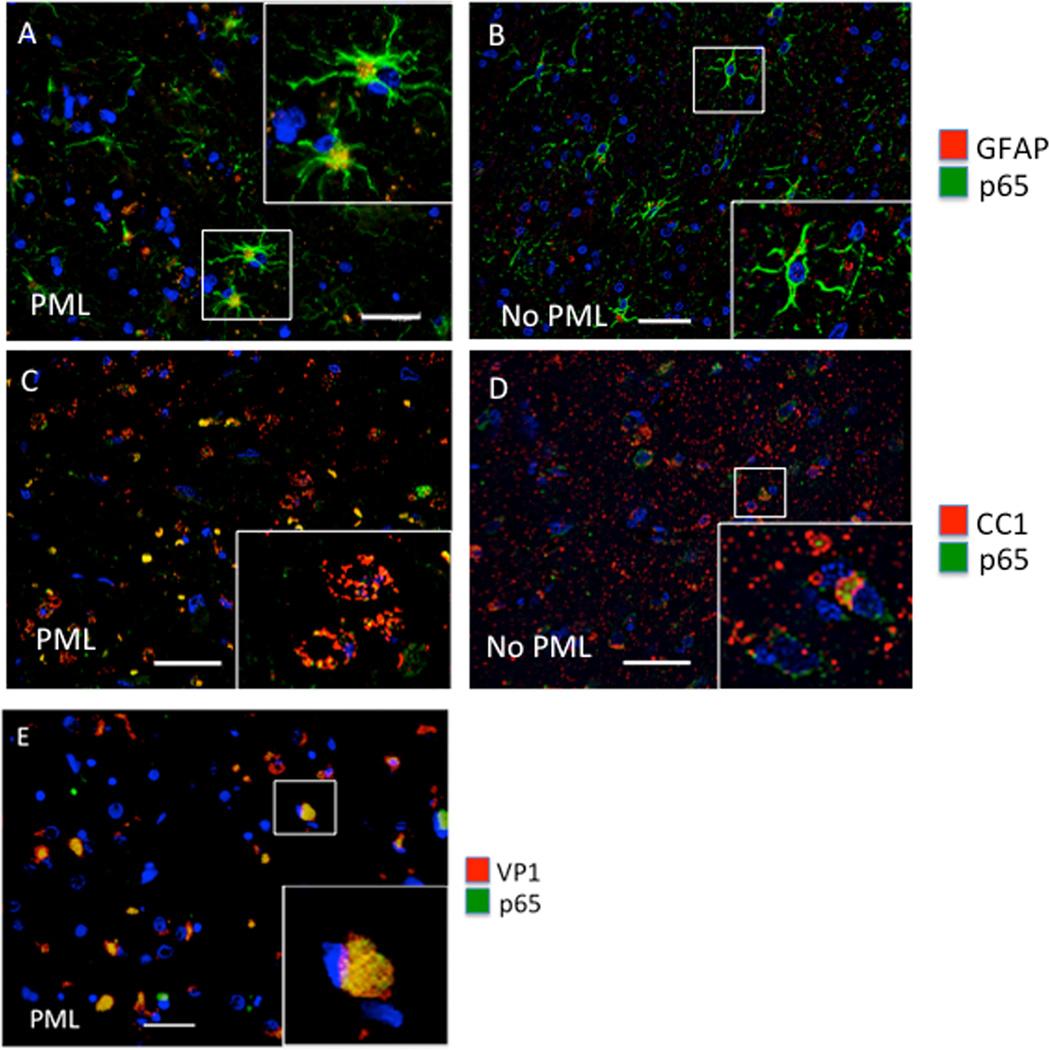
Figure 3. Analysis of NF-κB p65 in HIV-1/PML clinical samples by IHC.
Double immunofluorescence labeling of frontal cortex tissues from representative cases with HIV and HIV-1/PML (PML) (A, C), and HIV without PML (no PML) (B, D). Sections are labeled with anti-GFAP for astrocytes (red) and anti-p65 (green) (A, B), or anti-CC1 (red) for oligodendrocytes and anti-p65 (green) (C, D). Panel E is from an HIV+PML case labeled for VP1 (red) and p65 (green). The magnification of all images is 400× and the bar is ~ 40 µm. Insets in each panel are enlarged to show detail.

