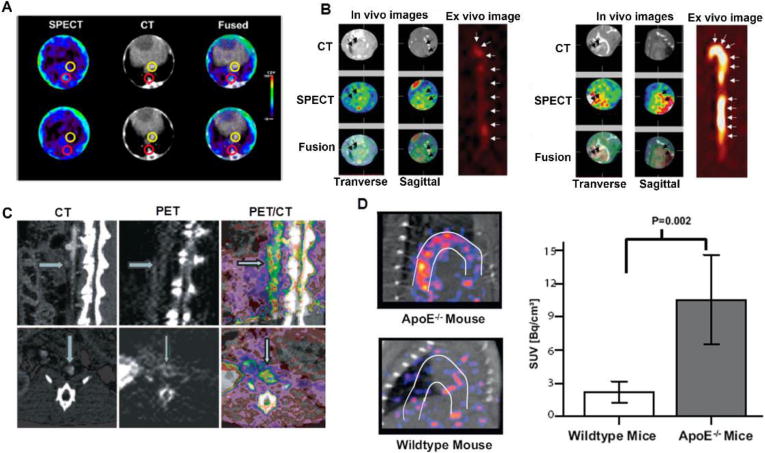
Figure 3.

Representative images determining the progression of atherosclerosis. (A) Transversal SPECT/CT imaging using 111In-RP782 radiotracer in apoE-/- mice with aorta uptake indicated by red circles and the inferior vena cava circled in yellow. (B) In vivo SPECT/CT and ex vivo autoradiography images of the aorta after injection of 99mTc-annexin A5 in the control (left image) and LDLR-/- (right image) mice with the highest uptake evident in the atherosclerotic model. (C) PET/CT imaging in an atherosclerotic rabbit injected with 18F-AppCHFppA by sagittal sections in the upper row and transversal sections in the lower row, with arrows indicating the lumen by CT and arterial wall by PET imaging. (E) Higher uptake in aortic arch of apoE-/- compared to wild type mice that received 64Cu-CD68-Fc-NOTA by PET/CT images with the SUV data quantification from the images. Modified with permission [43-46].
