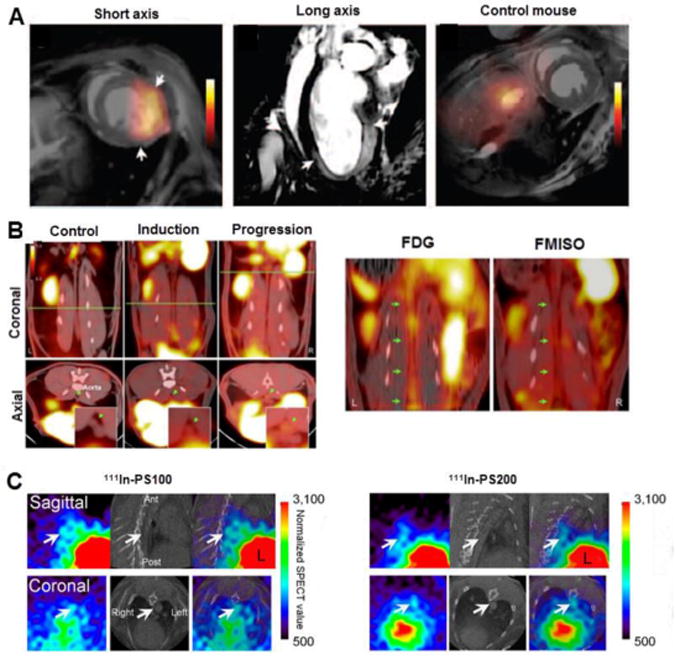
Figure 4.

Radiotracers imaging atherosclerotic plaque complication. (A) PET/MRI imaging after injection of 18F-FXIII/myeloperoxidase-MPO-Gd in the myocardial infarction model WT mice, with the arrows indicating border regions of infarct, with increased signal by MRI image (center) and no uptake of 18F-FXIII/MPO-Gd observed in control mice. (B) Uptake of 18F-FMISO for hypoxia imaging in atherosclerotic rabbits with 8 months (induction) and 16 months of atherogenic diet (progression) by PET/CT imaging, demonstrating higher signal compared to control rabbits. The green line is related to axial views captured in bottom of the image and green arrows are showing abdominal aorta. Comparisons between FDG and FMISO uptake specificity by PET/CT imaging were made, indicated by green arrows. (C) In vivo SPECT/CT imaging in the aorta (arrows) of WHHL rabbits injected with 111In-PS100 and 111In-PS200. Images modified with permission [47-49].
