
Fig. 3.
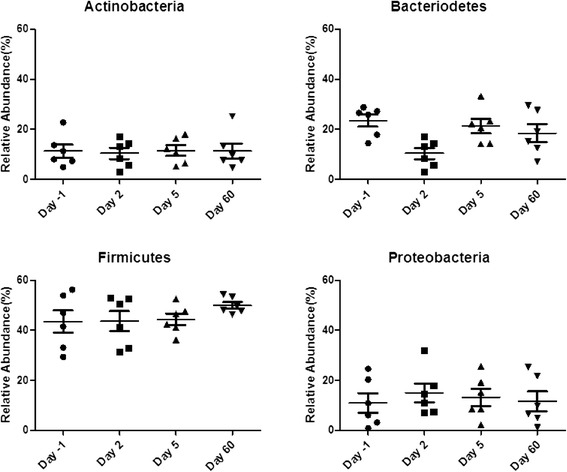
Bacterial Phyla. The distribution (and means ± SEM) of the top four phyla grouped by each time point: (day -1 (circles), day 2 (squares), day 5 (triangles pointing up), day 60 (triangles pointing down). No significant changes from baseline were observed in any of the phyla following HRV-16 infection (p > 0.05 across time points for all phyla using repeated measures ANOVA)