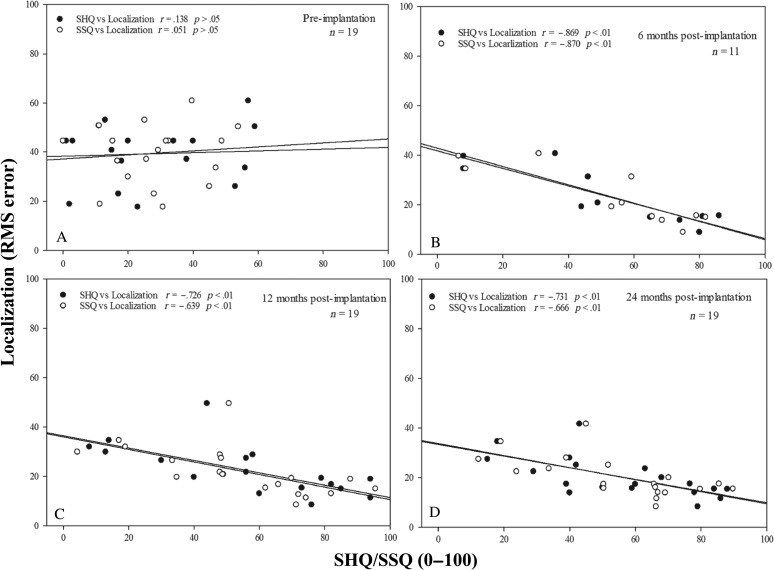
Figure 5.
Correlations of Spatial Hearing Questionnaire (SHQ) scores; Speech, Spatial and Qualities of Hearing Scale (SSQ) scores; and localization performances over time. Panel A: Preimplantation correlations from the same 19 subjects shown in Figure 1A. Panel B: The 6-month postimplantation correlations from the same 11 subjects shown in Figure 1B. Panel C: The 12-month postimplantation correlations from the same 19 subjects shown in Figure 1A. Panel D: The 24-month postimplantation correlations from the same 19 subjects shown in Figure 1A. Localization performances are expressed as root-mean-square (RMS) error scores. SSQ scores are changed into 100 scales for comparisons. r = Pearson correlation coefficients. Significant differences are marked in the figures.

