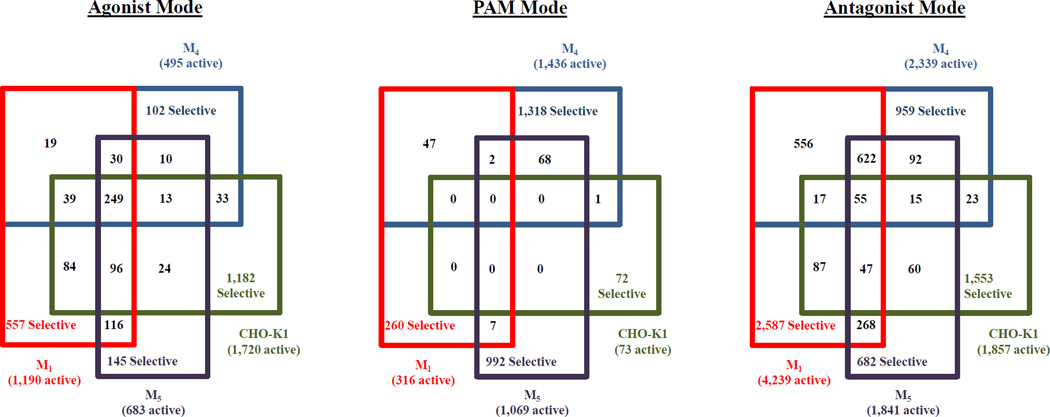
Figure 4.
4-way Venn diagram for muscarinic screens in the three modes. Data from the primary assays for M1, M4, M5 and parental CHO-K1 cells are shown here. The numbers in parenthesis next to the target are the number of hits specific for that screening mode. The numbers in the various boxes represent the number of compounds found to respond in those overlapping assays.

