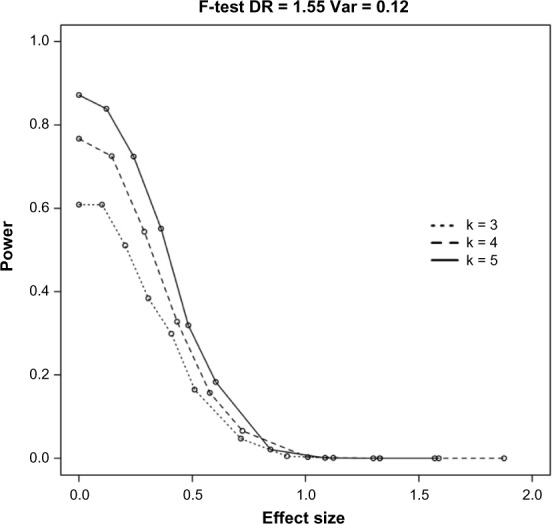
Figure 2.

The power of the F-test is affected by a number of groups. In this figure, the power is given for a DR of 1.55, variance of 0.12, and sample size of 6. k, group numbers. Adjusted effect size is calculated as the square root of the noncentrality parameter as given in the methods on simulations.
