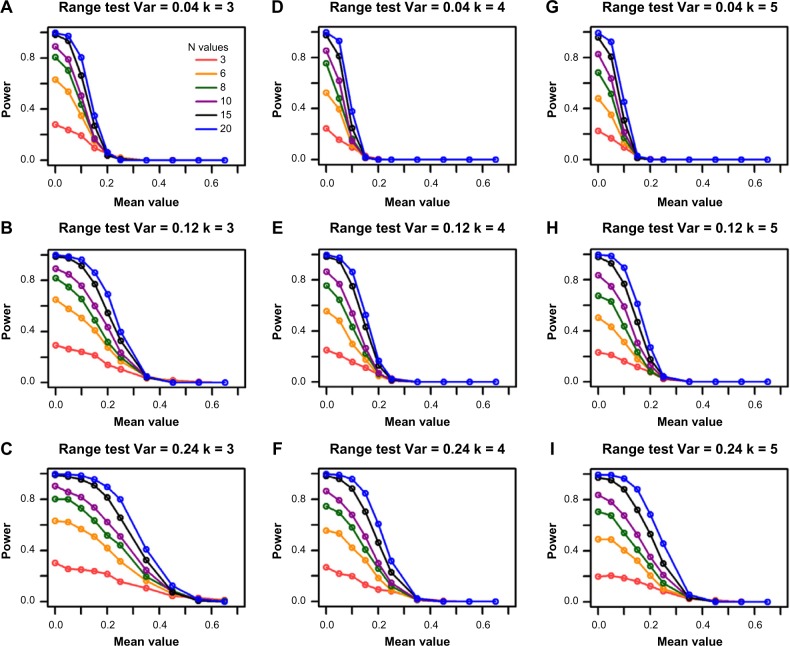
Figure 3.
Power for the range test from the single-gene simulations. The columns represent the different group sizes, k = 3, 4, 5, and the rows represent different variances, σ2 = 0.04, 0.12, 0.24. The sample sizes (N values) are indicated by the legend in the first panel. The simulated mean value represents the group mean values denoted as “a” throughout the text. The DR is set as 1.55.

