Figure 3.
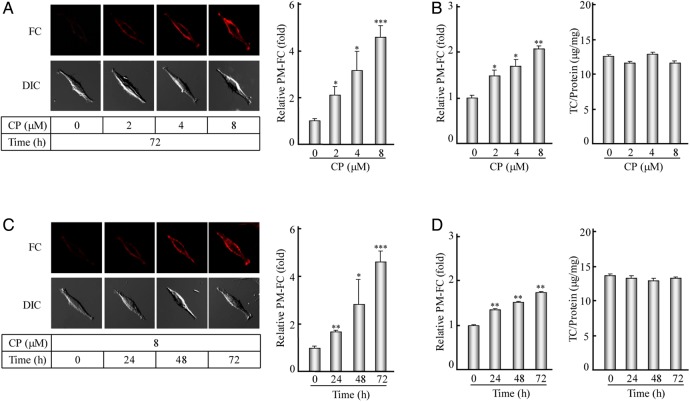
Filipin staining and determination of the PM-FC after the ACAT1 inhibition (A) The human SK-N-SH cells were treated with the CP at different concentrations (0, 2, 4, or 8 µM) for 72 h. The filipin staining and the corresponding quantification of the PM-FC were performed according to the procedures described in the ‘Materials and Methods’. The data were the mean ± SD from filipin signals of 50 stained cells randomly. The relative PM-FC were expressed as fold to the control without the CP treatment. (B) The PM-FC and TC of the cells treated as indicated in (A) were determined according to the cholesterol assay procedures described in the ‘Materials and Methods’. The data were the mean ± SD from two independent experiments. The relative PM-FC were expressed as fold to the control without the CP treatment. (C,D) The human SK-N-SH cells were treated with 8 µM CP for different time intervals (0, 24, 48, or 72 h). The data were obtained by the same methods as indicated in (A) and (B), respectively. ***P < 0.001; **P < 0.01; *P < 0.05.

