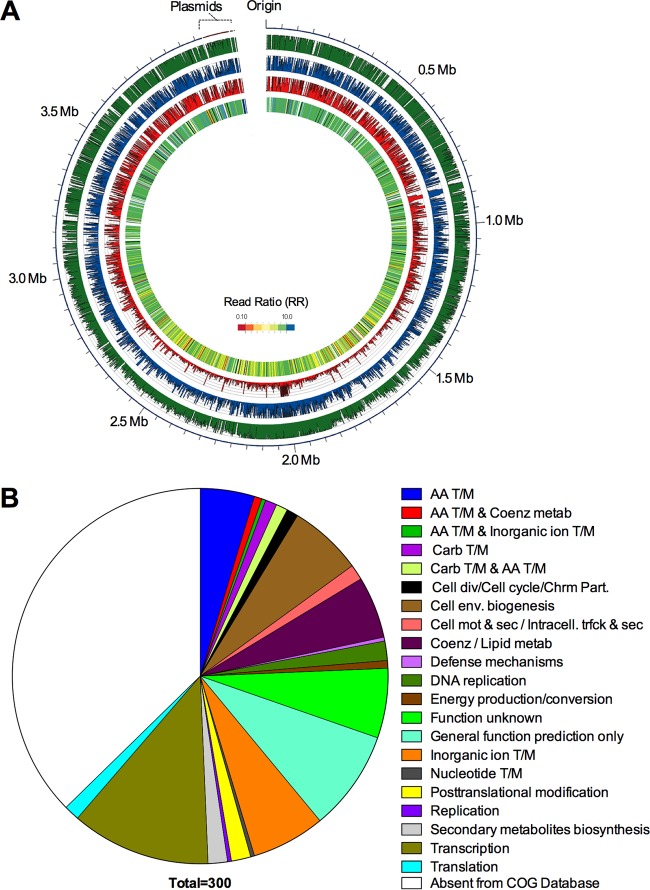
FIG 2 .
TnSeq experiment. (A) TnSeq experiment data. The outermost ring depicts the AB5075 chromosome and plasmids. The three middle rings depict the numbers of hits per gene in the pregrowth, LB growth, and Galleria growth samples (green, blue, and red, respectively). The innermost ring is a heat map of the RR of the Gm to the LB samples (Gm-essential genes are red). Essential genes are white, and genes with a general growth defect are black. The image was created with Circos (61). (B) Pie chart depicting Gm-essential hits grouped by COG categories. AA, amino acid; T/M, transport and metabolism; Coenz, coenzyme; metab, metabolism; Carb, carbohydrate; div, division; Chrm Part., chromosome partitioning; env., envelope; mot & sec, motility and secretion; Intracell. trfck & sec, intracellular trafficking and secretion.

