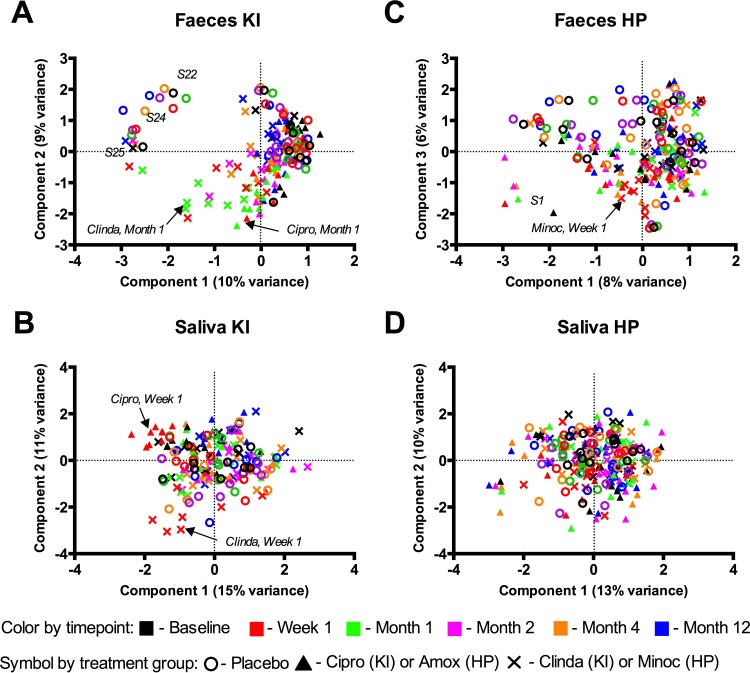
FIG 2 .
Effects of antibiotics on microbiome profiles of feces (A) and saliva (B) from the KI study and feces (C) and saliva (D) from the HP study. The PCA plot is based on log2-transformed OTU data. Different colors indicate different time points; different symbols indicate different treatment groups. Outliers in the KI (A) and HP (C) fecal data sets are highlighted with the respective subject number.

