FIG. 1.
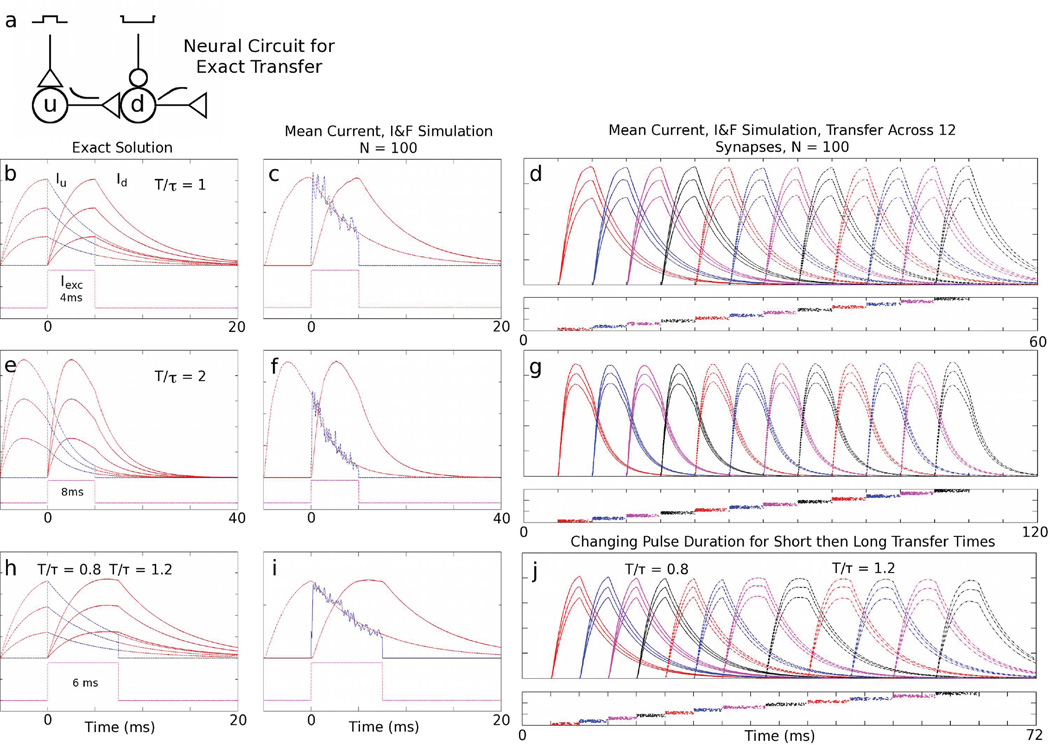
Exact current transfer - Mean-field and I&F: a) Circuit diagram for the current transfer mechanism. Excitatory pulse gating the upstream (u) population and ongoing inhibition acting on the downstream (d) population. The upstream population excites the downstream population and transfers its current. b, e) Dynamics of a single current amplitude transfer with T/τ = 1 and T/τ = 2 with τ = 4 ms. Dashed red traces represent the growth and exponential decay of three different current amplitudes, Iu(t), in the upstream population. Dashed blue traces represent excitatory firing rates of the upstream population. Solid red traces represent the integration and subsequent decay of the downstream current, Id(t). Dashed magenta traces represent the excitatory gating pulse current to the upstream population. Magenta traces are displaced from zero for clarity. c, f) Dynamics of two N = 100 neuron populations of current-based, I&F neurons showing current amplitude transfer averaged over 20 trials. d, g) Mean current amplitudes of twelve current-based, I&F neuronal populations (N = 100 neurons/population, averaged over 20 trials) successively transferring their currents. Below each of these panels is a plot of one realization of the spike times for all neurons in each respective population. h) Dynamics of a single current amplitude transfer between two gating periods, with T/τ = 0.8 and T/τ = 1.2. i) Dynamics of two N = 100 neuron populations showing current amplitude transfer with the same gating periods as in i). j) Five graded current amplitude transfers between six populations with T/τ = 0.8, followed by a transfer to T/τ = 1.2, followed by five equally graded transfers with T/τ = 1.2.

