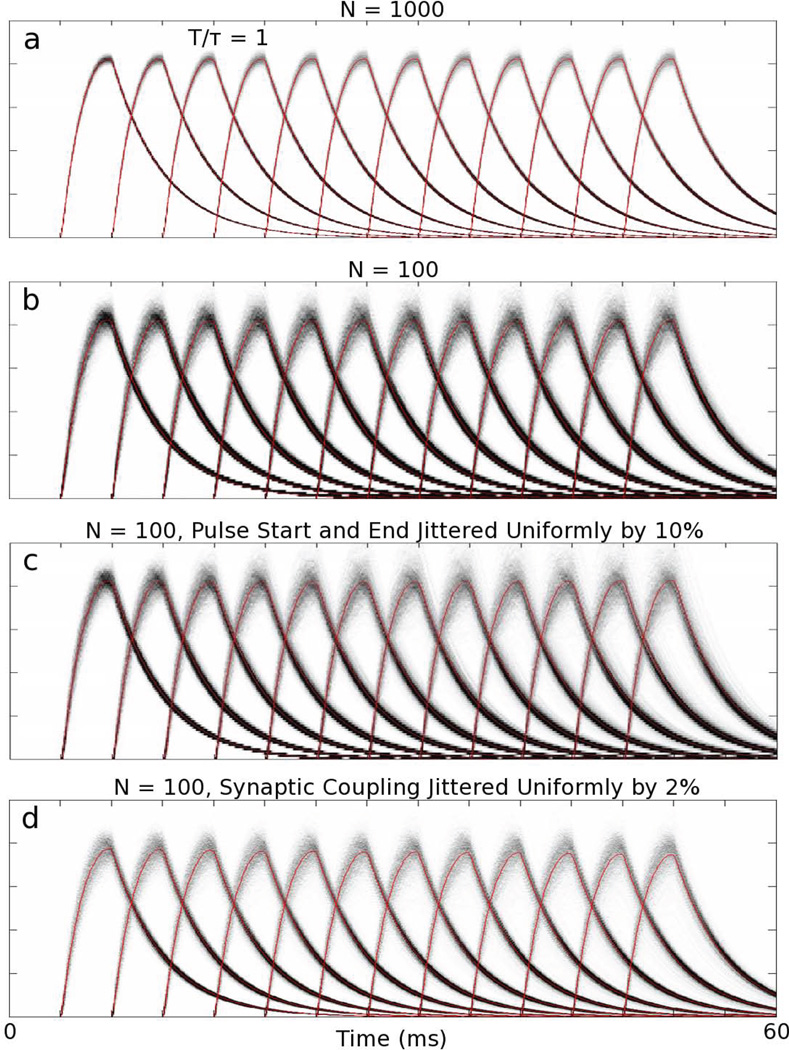
FIG. 2.
Sources of variability in the current transfer mechanism: Distributions of mean current amplitudes from current-based, I&F neuronal simulations. a) N = 1000. b) N = 100. c) N = 100 with the start and end times of each pulse jittered uniformly by 10% of the pulse width. d) N = 100 with synaptic coupling, S, jittered uniformly by 2%. Gray scale: White denotes 0 probability, Black denotes probability maximum. All distributions sum to unity along the vertical axis. Red curves in all panels denote the mean.

