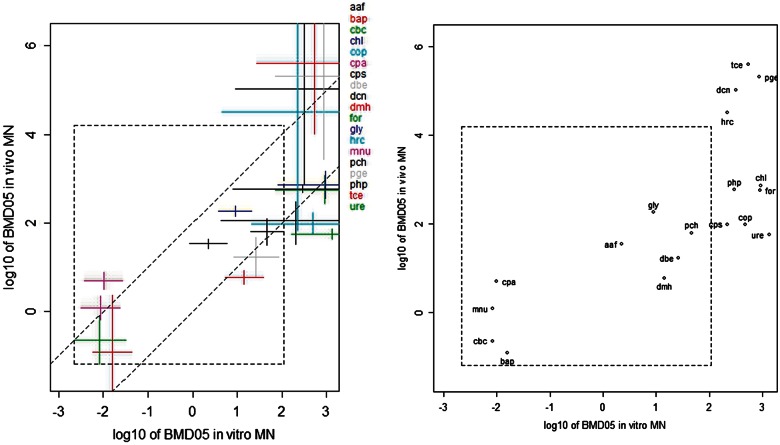
FIG. 2.
BMD confidence intervals for in vivo MN studies against those for in vitro MN studies. In both types of studies the BMD relates to BMR = 5%. The x-axis represents log10 of concentration in µg/ml, the y-axis log10 of dose in mg/kg/day. The 2 parallel lines have a slope 1, and were drawn by eye such that they span 2 orders of magnitude in vertical direction. See Table 1 for abbreviations of the associated individual compounds. Abbreviations: BMD, Benchmark dose; MN, micronucleus.

