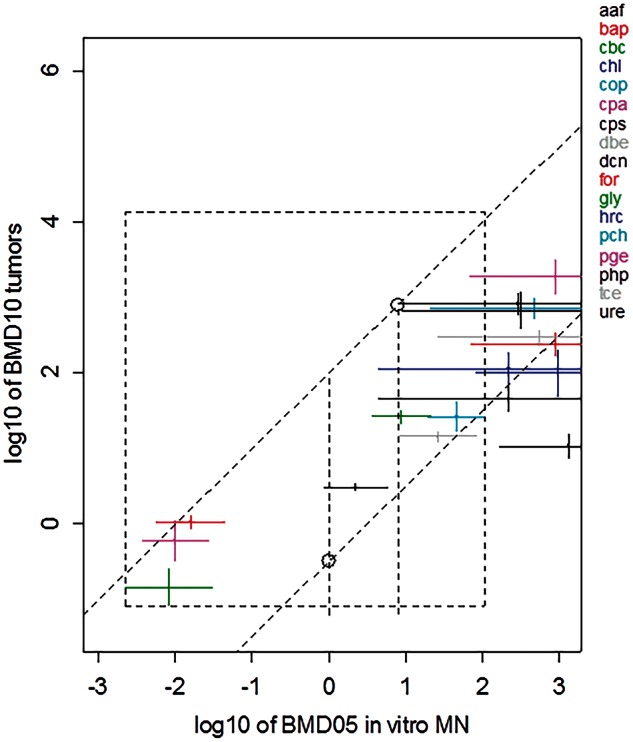
FIG. 3.

BMD10 confidence intervals from carcinogenicity studies (lowest found for malignant tumors in a single tissue) against BMD05s from in vitro MN test. The latter are the same as those in Figure 2. The x-axis represents log 10 of concentration in µg/ml, the y-axis log10 of dose in mg/kg/day. The 2 parallel lines roughly encompass the observed BMD confidence intervals as found in the test chemicals. By taking the lowest intersection point with the left vertical line and the highest intersection point with the right vertical line we obtain the uncertainty range for the predicted BMD10 for carcinogenicity (see the 2 plotted circles). In this way, both the prediction uncertainty related to the scatter in the correlation and the uncertainty in the BMD on the x-axis is taken into account. See Table 1 for abbreviations of the associated individual compounds. Abbreviation: BMD, Benchmark dose.
