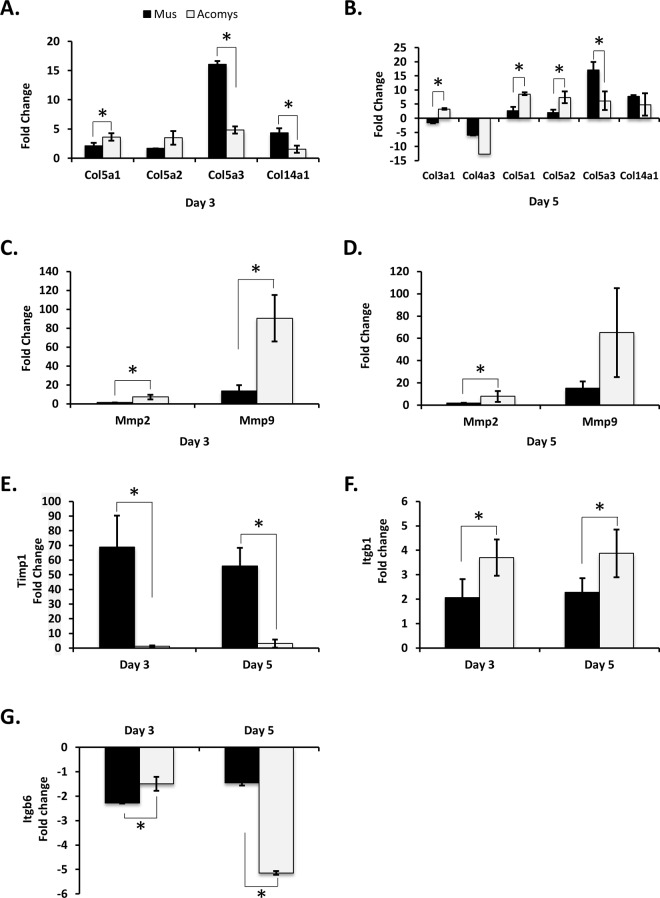
Fig 2. Differences in ECM composition, matrix digestion and cell motility between Acomys and Mus.
RT-qPCR analysis was performed for the following genes: Collagens were analyzed for day 3 (A) and day 5 (B) wounds. Mmp2 and 9 were analyzed for day 3 (C) and day 5 (D) wounds, Timp1 (E), Itgβ1 (F), and Itgβ6 (G). All labels, symbols and calculations are as those described in Fig 1.

