
Fig 4. PCA scores from analysis performed on the log10 proportions of OTUs identified in each individual coloured by health status; health (green), gingivitis (yellow) and mild periodontitis (red).
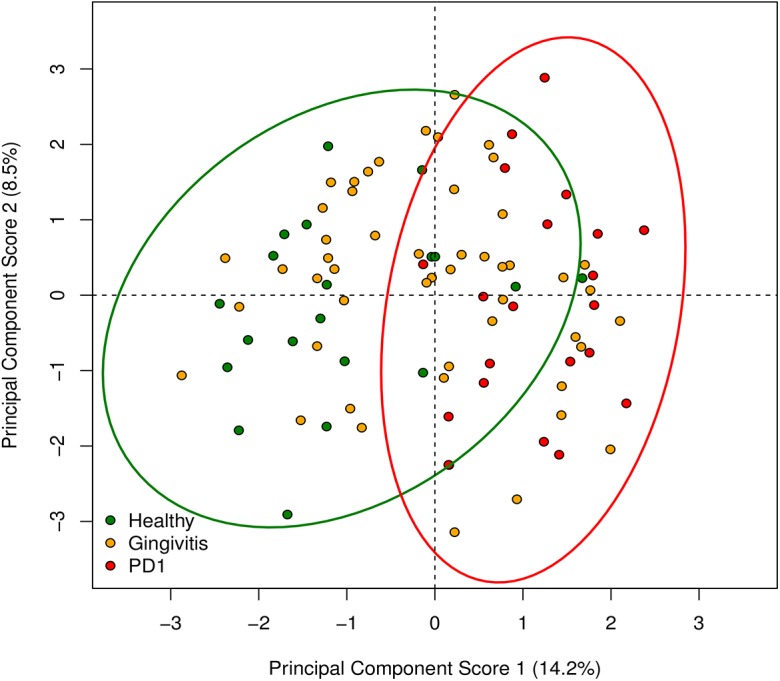
The 95% confidence ellipses for the scores were calculated by the R package vegan.