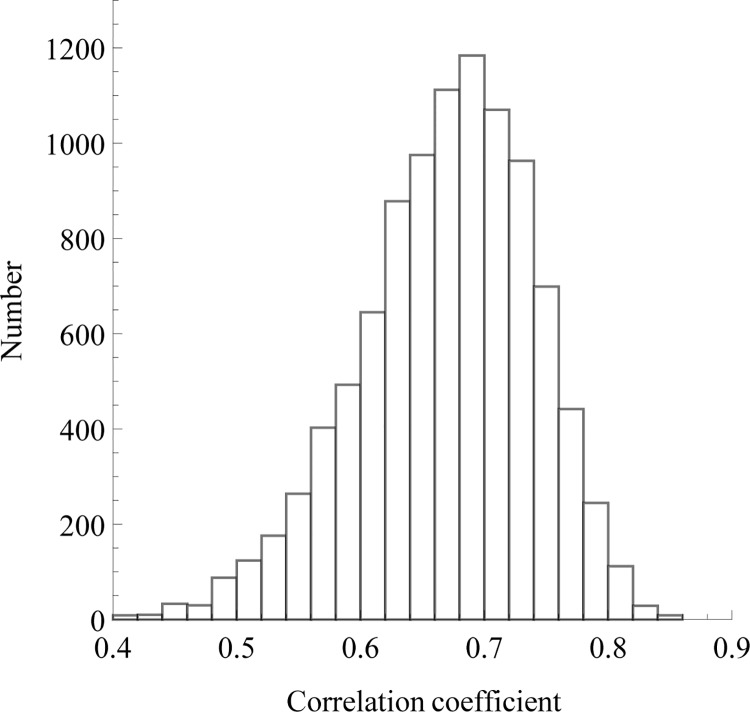
Fig 2. Correlation coefficient of Huang and Tian’s model for different samples.
Forty data points were randomly sampled from a meta data set and the model described by Huang and Tian [26] was fitted again 10,000 times. The meta data set consists of two-state proteins from 30 to 200 residues combined from [26] and data set 113, without duplicates. The histogram of the obtained correlation coefficients was then plotted. The correlation coefficient ranges from 0.5 to 0.8 approximately, which shows that robust estimation of the correlation cannot be achieved with 40 proteins.

