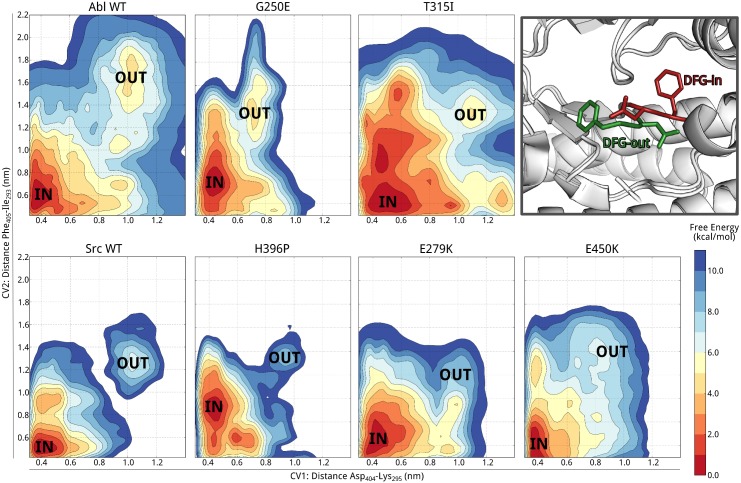
Fig 3. Free energy of the DFG flip transition.
Free energy surfaces of Abl, Src (adapted from Ref. [29]), and Abl drug-resistant mutants projected on the distances between DFG Asp404 and Lys295 (CV1) and DFG Phe405 and Ile293 (Leu137 in Src) (CV2). The free energy minima corresponding to DFG-in conformations are labeled “IN”, while “OUT” correspond to DFG-out conformations. The contour lines are drawn every 1 kcal/mol.

