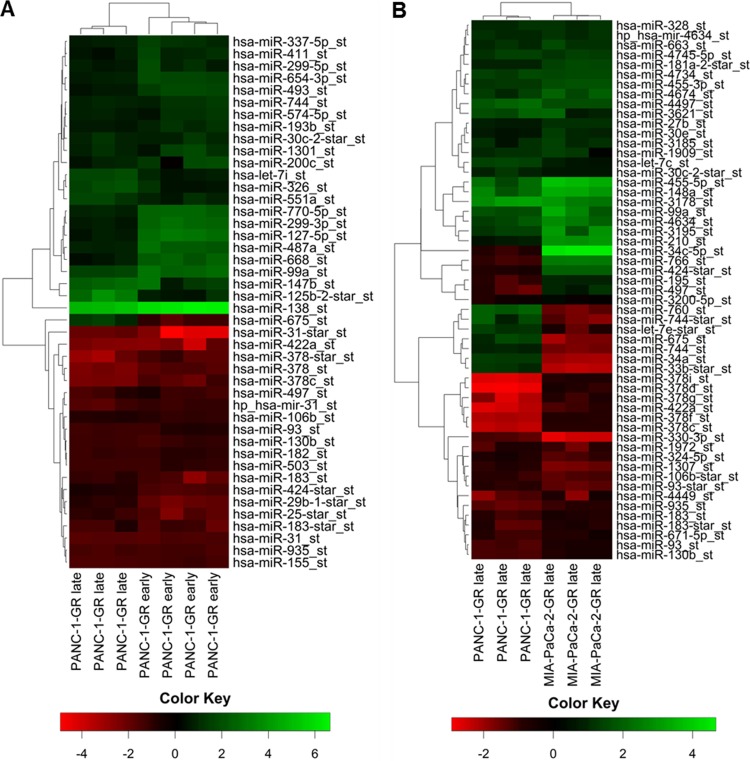
Fig 5. MicroRNA heat mapping.
Hierarchical cluster heat maps of significantly dysregulated miRs in PANC-1-GR late and early cell passage (A) as well as in PANC-1-GR and MIA-PaCa-2-GR late cell passage (B). Each row shows the relative expression level for a single miR and each column shows the expression level for a single sample; fold change greater than ±2 (p<0.05). The red or green color indicates low or high expression, respectively.

