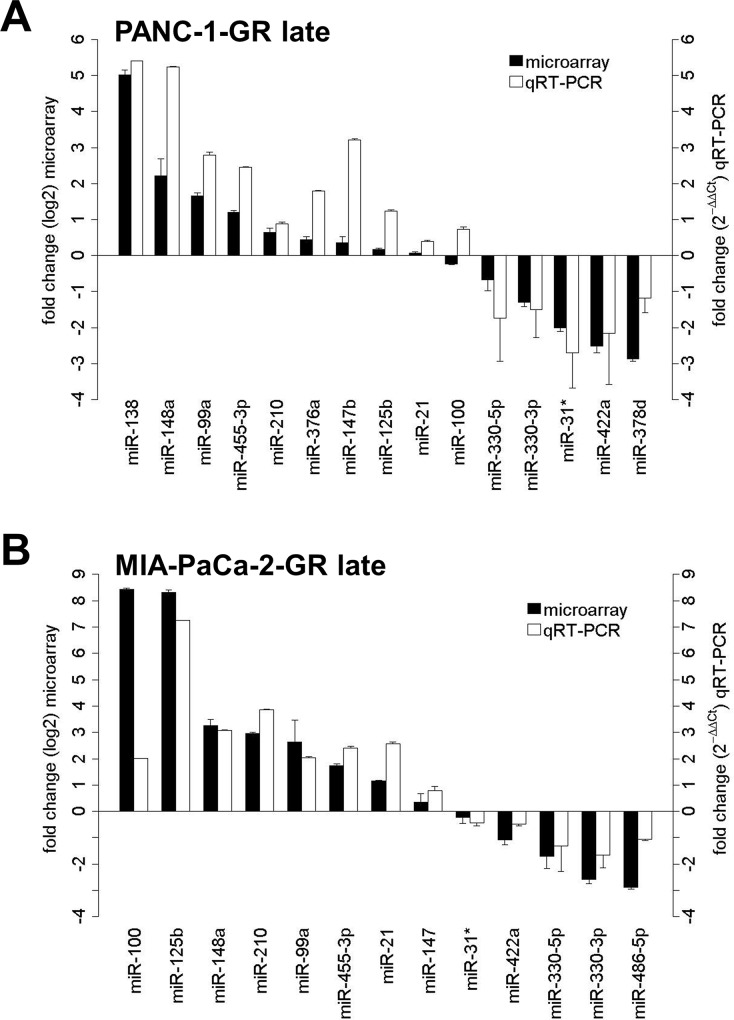
Fig 6. MicroRNA microarray validation.
MiR microarray validation with qRT-PCR for significantly dysregulated miRs in PANC-1-GR (A) and MIA-PaCa-2-GR cell clones (B). Fold change from miR microarray is demostrated by log2 values (left y-axis, dark grey bars). Fold change from qRT-PCR was determined using the 2-ΔΔCt method (right y-axis, light grey bars). Error bars represent the standard deviation of mean.

