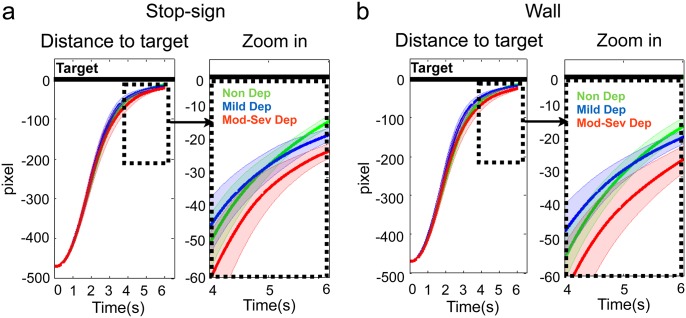
Fig 3. Car distance as a function of time within a trial (6-seconds): a (stop-sign), b (wall).
Black solid line: the position of the target (stop-sign or wall). Green solid line: Non Dep. Blue solid line: Mild Dep. Red solid line: Mod-Sev Dep. For each condition, car distance to task target as a function of time is plotted on the left, and zoom-in in the last 2 seconds is plotted on the right.

