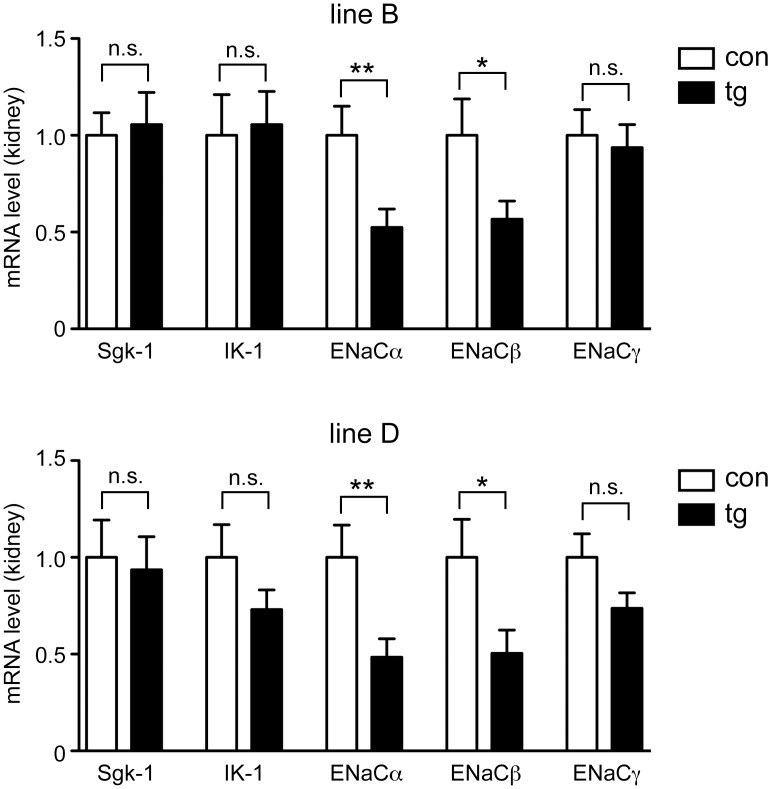
Fig 3. Gene expression analysis in the kidney of inducible MR knock-down mice.
Control (con) and transgenic (tg) mice of line B (upper panel) and line D (lower panel) received Dox via food pellets for 14 days. Subsequently, whole kidneys were analyzed for mRNA expression of serum and glucocorticoid-regulated kinase 1 (Sgk-1), the potassium channel IK-1 and the subunits α, β and γ of the epithelial sodium channel ENaC by RT-QPCR. N = 16/24 (line B), N = 19/22 (line D). Gene expression was normalized to HPRT, and mRNA levels in control mice were arbitrarily set to 1. Values are depicted as mean ± SEM, statistical analysis was performed by unpaired two-tailed Student’s t test. n.s.: non-significant; *: p <0.05; **: p <0.01.

