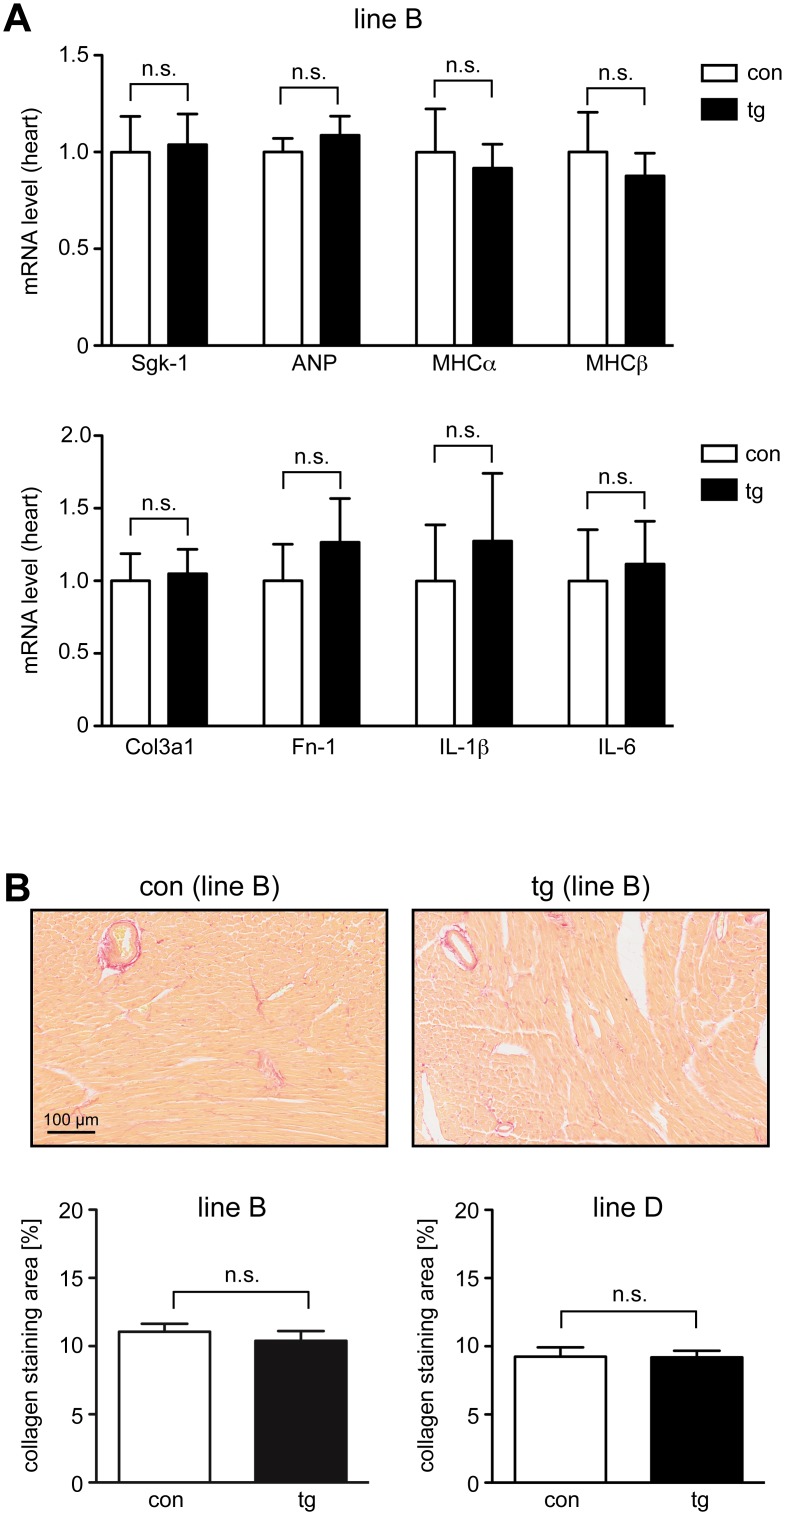
Fig 5. Gene expression analysis and collagen deposition in the heart of inducible MR knock-down mice.
(A) Control (con) and transgenic (tg) mice of line B received Dox via food pellets for 14 days. In the upper panel, analysis of the heart for mRNA expression of serum and glucocorticoid-regulated kinase 1 (Sgk-1), the hormone ANP and the structural proteins MHCα and β by RT-QPCR is depicted. N = 10/17. In the lower panel, analysis of the heart for mRNA expression of Col3a1 (Collagen, type III, α1), fibronectin (FN-1) and the pro-inflammatory cytokines IL-1β and IL-6 by RT-QPCR is depicted. N = 3/4. Gene expression in panel A was normalized to HPRT; mRNA levels in control mice were arbitrarily set to 1 and are depicted as mean ± SEM. (B) Control (con) and transgenic (tg) mice of line B and D received Dox via food pellets for 28 days. Exemplary photographs of heart sections of one control and one transgenic mouse of line B, stained with picrosirius red are depicted in the upper panel. The red color corresponds to collagen mainly found around vessels. Size bar: 100 μm. The lower panel shows computer-aided quantification of the collagen staining area in control and transgenic mice of both line B and D. N = 5/5 (line B), N = 3/5 (line D). Values in panel B are depicted as mean ± SEM, statistical analysis was performed by unpaired two-tailed Student’s t test. n.s.: non-significant.

