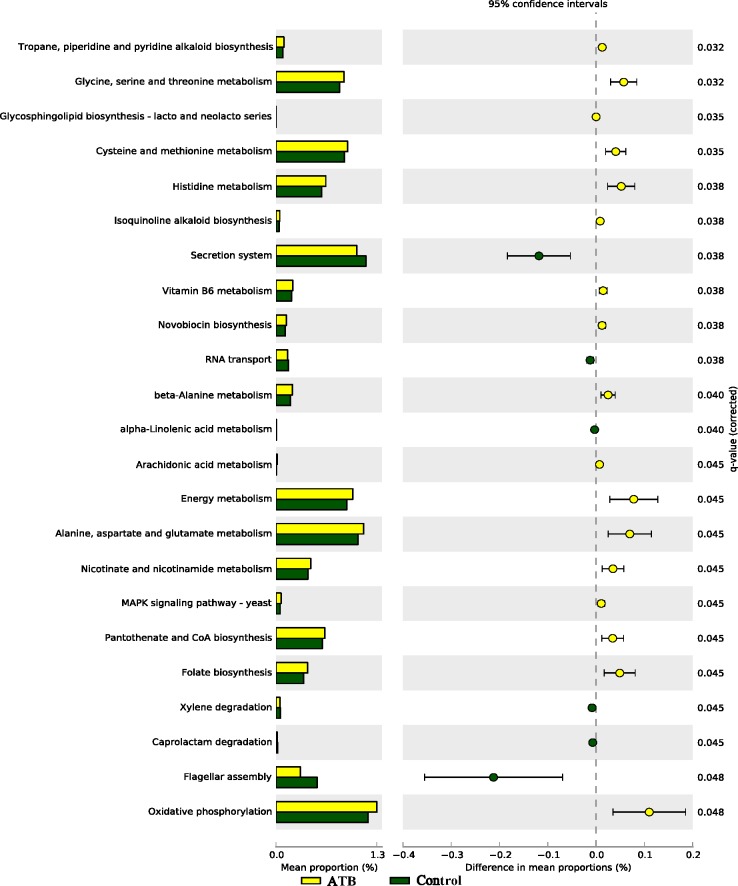
Fig 6. Subsystems and pathways enriched or decreased within fecal microbiome from Control and ATB groups before induction of colitis.
Corrected P values were calculated using the Storey false discover rate (FDR) correction. Subsystems or pathways overrepresented in the ATB (Control) fecal samples have a positive (negative) difference between mean proportions and are indicated by white (black) color. 10 mice per group.

