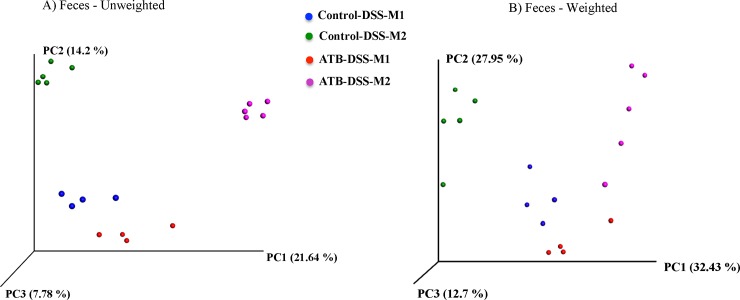
Fig 10. Principle coordinate analysis (PCoA) of (A) Unweighted (P = 0.0001) and (B) Weighted (P = 0.0001) UniFrac distances in fecal microbiota after induction of colitis.
Fecal samples clustered according to the treatment and the mother (P = 0.001) further influenced the clustering. The P values were determined using PERMANOVA. 10 mice per group (two samples were excluded due to very low sequencing depth). Control-DSS-M1 and Control-DSS-M2 shows mice in the control group but from two different mothers; ATB-DSS-M1 and ATB-DSS-M2 shows mice in the ATB (antibiotic) group but from two different mothers.

