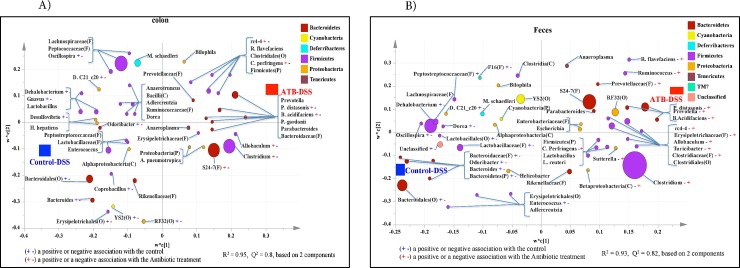
Fig 12. Partial least square discriminant analysis (PLS-DA) of bacterial communities comparing taxa that were associated with the Control-DSS or ATB-DSS treatments in the A) Colon mucosa, and B) Feces.
All taxa are colored based on the phyla to which they belong and sized based on their relative abundance. Some sequences could only be affiliated to phylum (p.), class (c.), order (o.), or family (f.) levels. Specific taxa were positively or negatively associated with each treatment group, which may be an indicator of shifts in the physiological or metabolic processes that may be influenced by the taxa. 10 mice per group.

