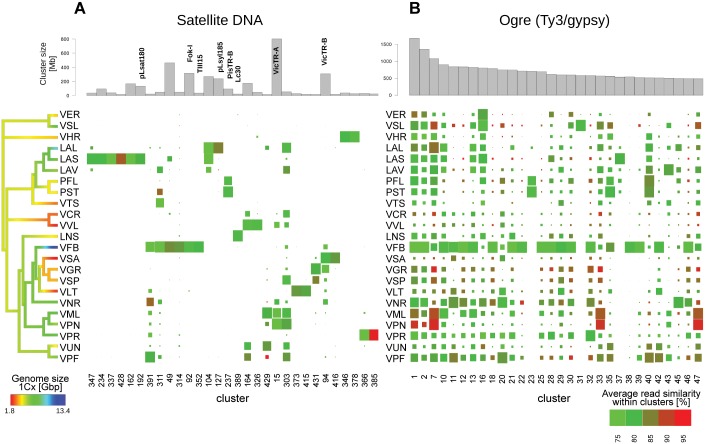
Fig 2. Phylogenetic distribution, abundance and sequence similarity between the thirty largest clusters representing satellite repeats (A) and Ogre retrotransposons (B) from the comparative clustering analysis.
Bar plots at the top show cluster sizes (total length of all reads in Mbp) and rectangle areas below display the relative proportions of reads from individual species within each cluster. Previously described families of satellite repeats are marked with their names on panel A. The colours of the rectangles indicate the average pairwise similarities of read sequences.

