
Fig 4. Sequence conservation of repeats between Fabeae species.
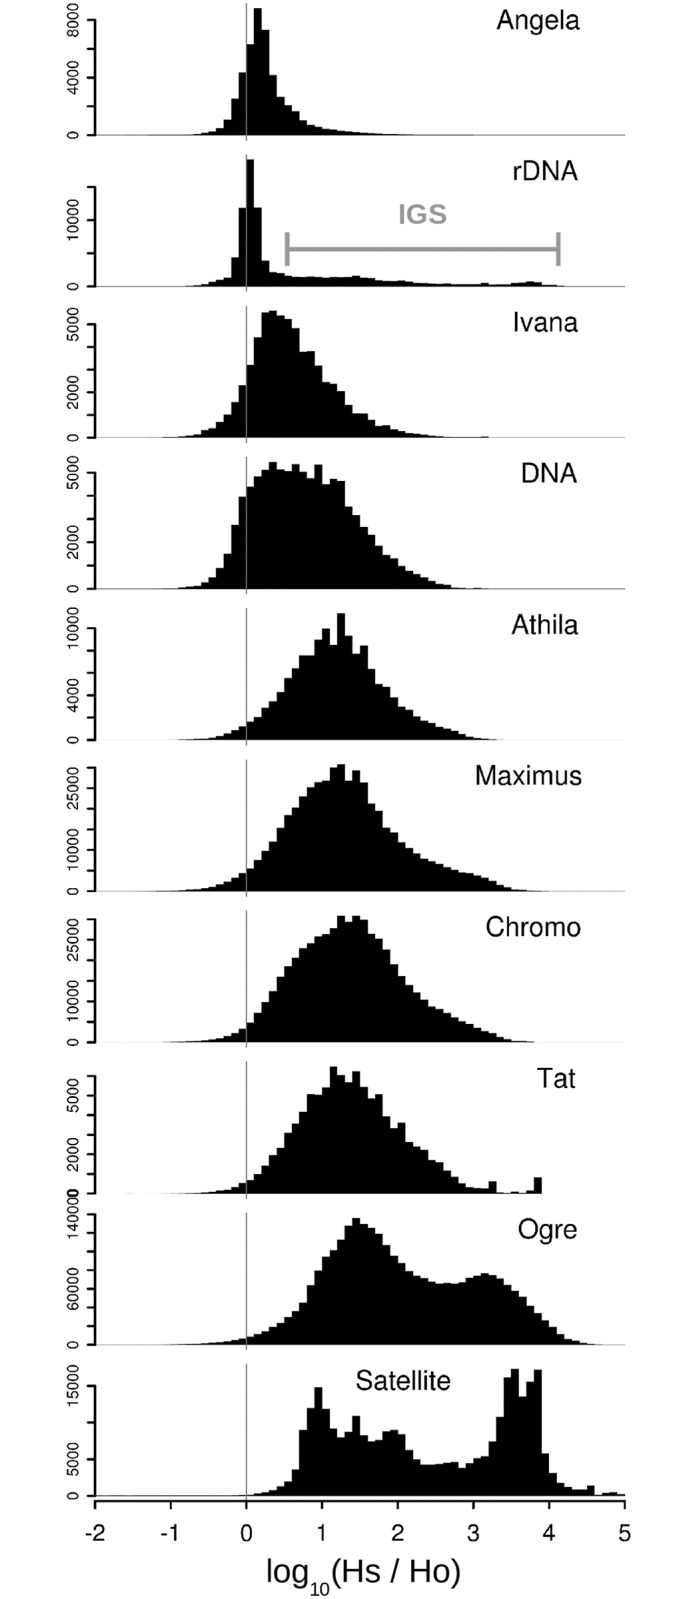
The ratio Hs/Ho was calculated for each read within individual groups of repeats, where Hs was the frequency of similarity hits to reads from the same species and Ho was the frequency of hits to reads from all other species. The histograms show the distribution of Hs/Ho ratios for different repeats, with numbers of reads plotted along the y-axis. The Hs/Ho ratios are close to 1 (0 on the log scale) for highly conserved sequences whereas larger values correspond to sequence divergence, resulting in higher frequencies of hits within than between species (for example, a value of 2 on the x-axis corresponds to reads producing 100-fold more intra-specific than inter-specific hits).