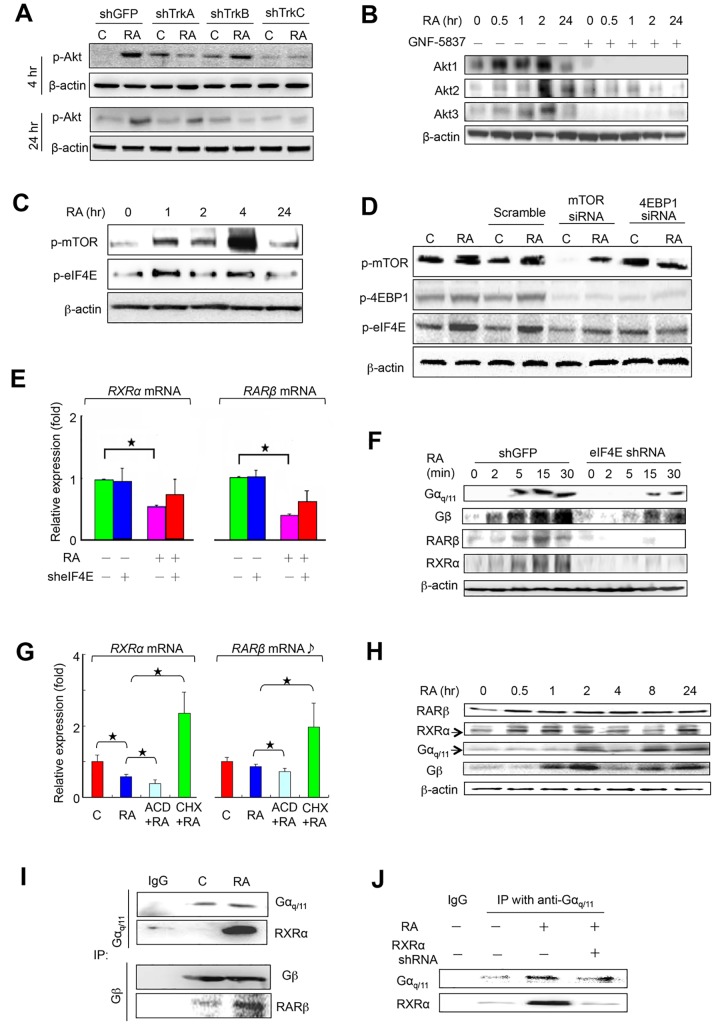
Fig 2. Subcellular Localization of RARβ and RXRα.
(A-B) Knockdown of TrkA and TrkB reduced Akt1 and Akt3 expressions at 4 hr (upper) and 24 hr (lower panel), respectively, evidenced by inhibitory GNF-5837 by immunoblotting assays. β-actin as loading control. (C) RA activated mTOR and eIF4E at 4 hr, but not 24 hr. (D) Knockdown of mTOR resulted in reduction of phosphorylation of 4EBP1, but not eIF4E, and knockdown of 4EBP1 did not reduce eIF4E. (E) RA reduced both RXRα mRNA (left) and RARβ mRNA (right) levels at 2 min by qPCR, but did not change by using eIF4E shRNA. Data represent mean ± SD, n = 6, ★:p < 0.05. (F) RA-induced expressions of Gαq/11, Gβ, RARβ and RXRα in a timeline and their responses by knockdown of eIF4E shRNA. shGFP as a positive control. (G) RA-reduced RXRα mRNA and RARβ mRNA levels were promoted by ACD (100 μg/ml), but not CHX (100 μg/ml) at 30 min by qPCR assay. Data represent mean ± SD, n = 4, ★:p < 0.05. C: control. (H) RA induced different expression patterns of RARβ, RXRα, Gβ and Gαq/11 by immunoblotting assay. (I) IP assay showed an interaction between Gβ and RARβ and also between Gαq/11 and RXRα while (J) knockdown of RXRα inhibited the latter.

