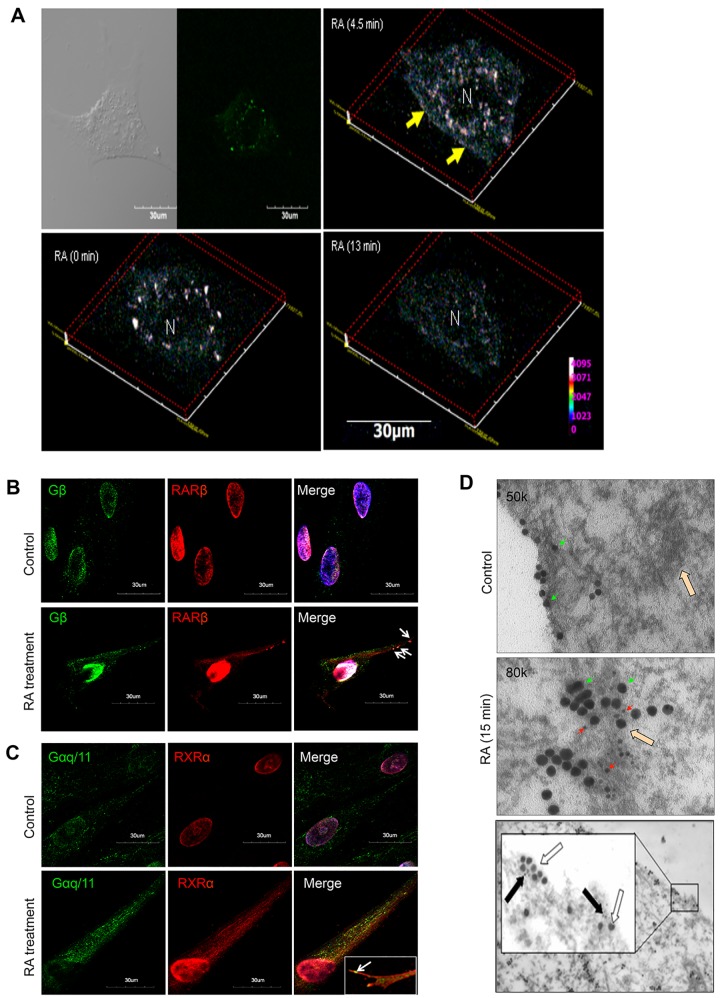
Fig 3. Imaging of RARβ/Gβ and RXRα/Gαq/11 Complexes.
(A) Representative micrographs of real-time confocal immunofluorescence microscopy showing RA at 0 min, 4.5 min, and 13 min. Bar scale: 30μm. (B) The distribution of Gβ (green) and RARβ (red) before RA stimulation (upper); while co-localization of them at the extended axonal membrane after RA (white arrow) (lower) and (C) a similar expression was observed in between Gαq/11 (green) and RXRα (red). Bar scale: 30μm. (D) Representative electron micrographs showing: the subcellular large gold-tagged Gαq/11 (20 μm, green arrow) and ER areas (blank arrow) before RA stimulation (upper). Co-localization of the small gold-tagged RXRα (6 μm, red arrow) and the large gold-tagged Gαq/11 (green arrow) at the ER areas (blank arrow) (middle) and at the subcellular regions after RA stimulation (15 min; lower). N: nucleus, Bar scale: 1 μm.

