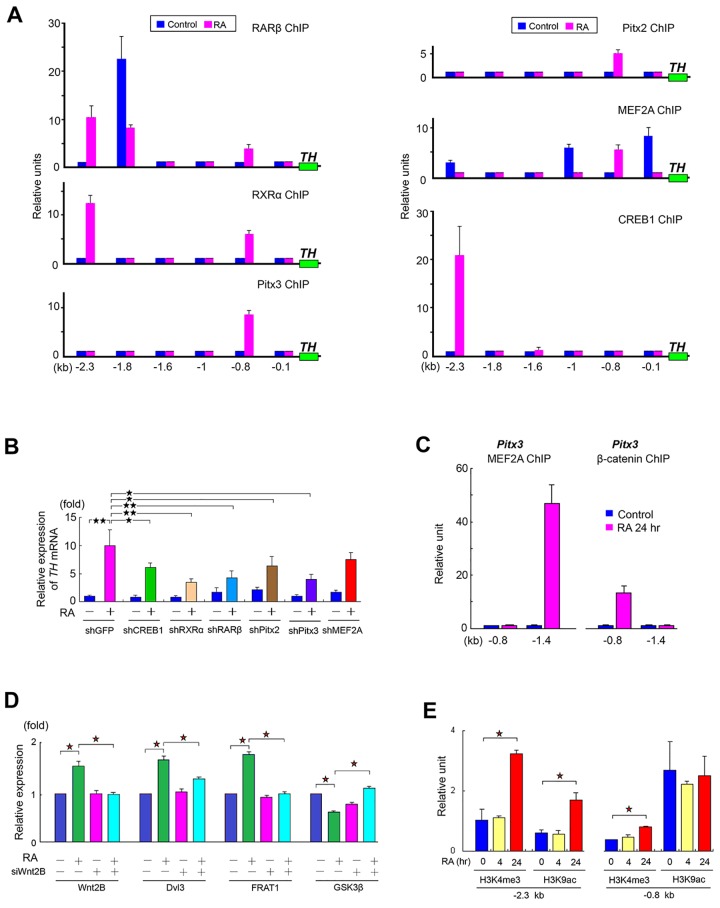
Fig 7. Activation of TH Gene Expression.
(A) ChIP-qPCR analysis by RA induction (24 hr) showing: RARβ (upper), RXRα (middle) and Pitx3 (lower) at left panel as well as Pitx2 (upper), MEF2A (middle) and CREB1 (lower) at right panel to target the promoter of TH gene at different sites to produce the different TH levels in hTS cells. (n = 4) (B) qPCR analysis showing the relative TH mRNA expression and effects of knockdown of various transcription factors using specific shRNAs in hTS cells. (n = 4), shGFP as positive control. (C) ChIP-qPCR analysis showing the transcriptional ability of MEF2A (left) and β-catenin (right) targeting gene Pitx3 at different sites. (n = 4) (D) Flow cytometric analysis of the effect of Wnt2B knockdown on the expressions of Wnt2B, Dvl3, FRAT1 and GSK3β at 24 hr of RA treatment. (n = 3) (E) RA activated H3K4me3 and H3K9ac at a different site of TH gene at 24 hr, but no change at 4 hr in hTS cells (n = 4). Data represent mean ± SD, ★: p < 0.05, ★★: p < 0.01.

