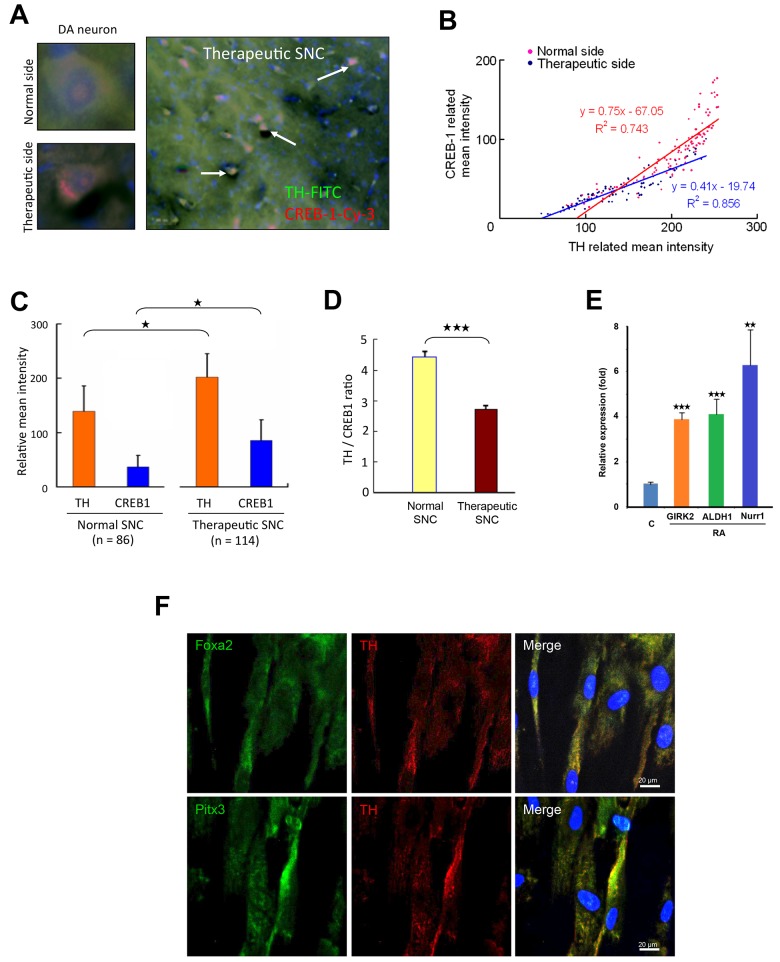
Fig 8. TissueQuest Analysis of TH and CREB1 Expressions in vivo.
(A) Left panel: Expression of immunoreactive CREB1 (red) and TH (green) in DA neurons in normal SNC (upper) and therapeutic SNC (lower). Right panel: Colocalization of TH and CREB1 in the regenerated DA neurons (arrow) of therapeutic SNC at 12-week postimplantation of the hTS cell-derived NSCs in PD rat brain. (B) A distributive correlation of CREB1 and TH intensity in DA neurons counted from the normal SNC and the therapeutic SNC after 12-week implantation. R2 = 0.856. (C-D) Comparison of relative expression of TH and CREB1 between the normal DA neurons (left, n = 86 cells counted) and the regenerated DA neurons (right, n = 114 cells counted) in a brain section at postimplantation (C) and the mean intensity of TH to CREB1 ratio in DA neurons is significantly lower in therapeutic SNC than normal SNC (D). (E) RA increases levels of GIRK2, ALDH1, and Nurr1 mRNAs after one-day incubation by qPCR assay. (F) Immunofluorescence imaging reveals co-expression of TH with Foxa2 and Pitx3. n = 4. Data represent mean ± SD, ★: p < 0.05, ★★: p<0.01, ★★★: p < 0.001.

