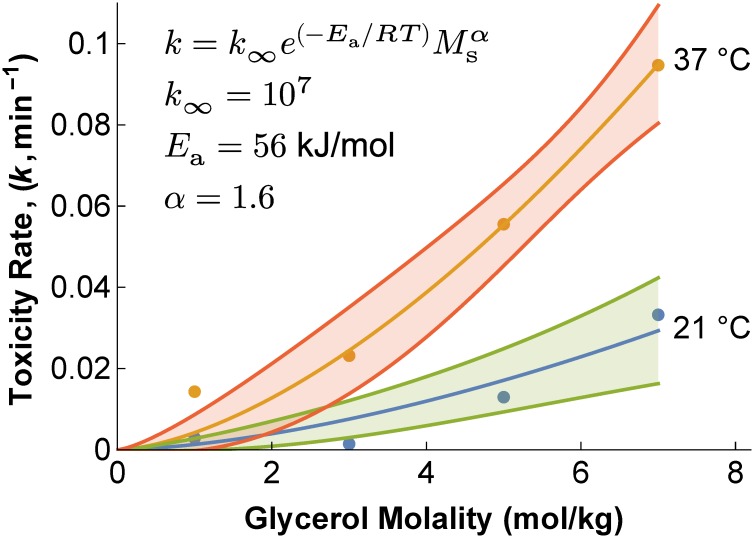
Fig 3. Effect of concentration and temperature on the toxicity rate constant k.
Lines represent predictions of the concentration- and temperature-dependent toxicity rate model (Eq 9), and the shaded bands represent 95% confidence intervals. Best-fit model parameters are shown on the plot.

