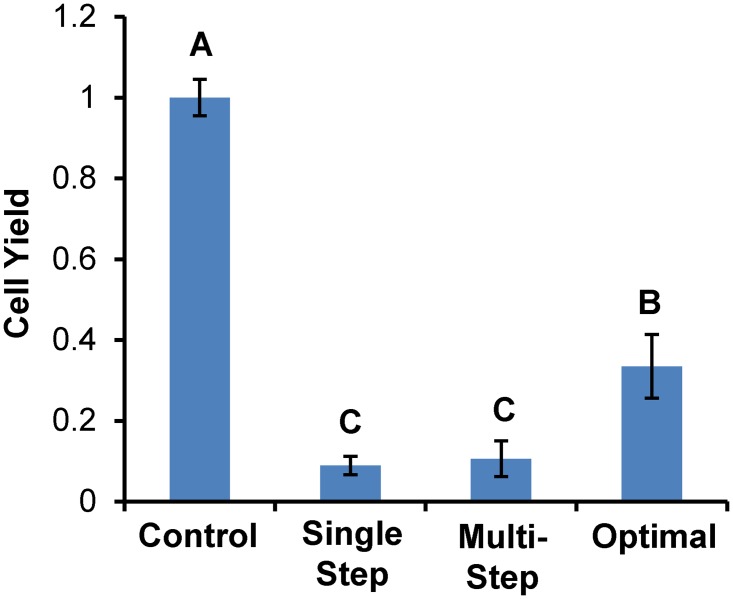
Fig 5. Cell yield for the mathematically optimized procedure in Table 1.
For comparison, the results for single step and conventional multistep procedures are also shown. All experiments were carried out at 37°C. Bars marked with distinct letters are significantly different (p < 0.05).

