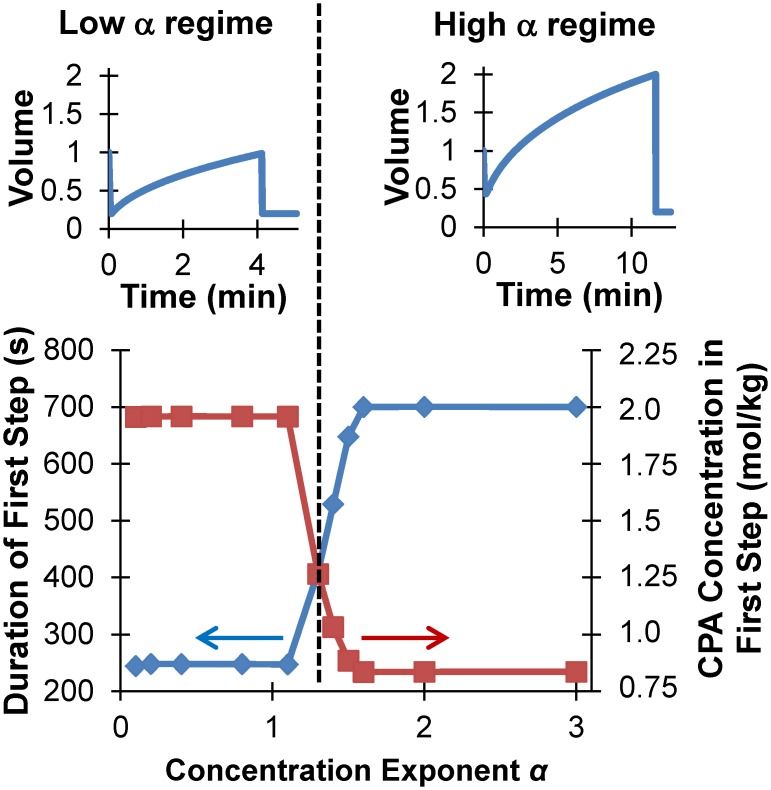
Fig 8. Effects of the CPA cytotoxicity model parameter α (see Eq 9) on mathematically optimized procedures for addition of 17 molal glycerol.
While the second CPA addition step was essentially identical for all α-values, the conditions in the first step can be divided into low α and high α regimes. In the low α regime, the cells are exposed to a relatively high CPA concentration for a relatively short duration (bottom panel), resulting in shrinkage to the minimum volume limit (top left panel). In contrast, the high α regime involves exposure to a relatively low CPA concentration for a relatively long duration, which results in swelling to the maximum volume limit (top right panel).

