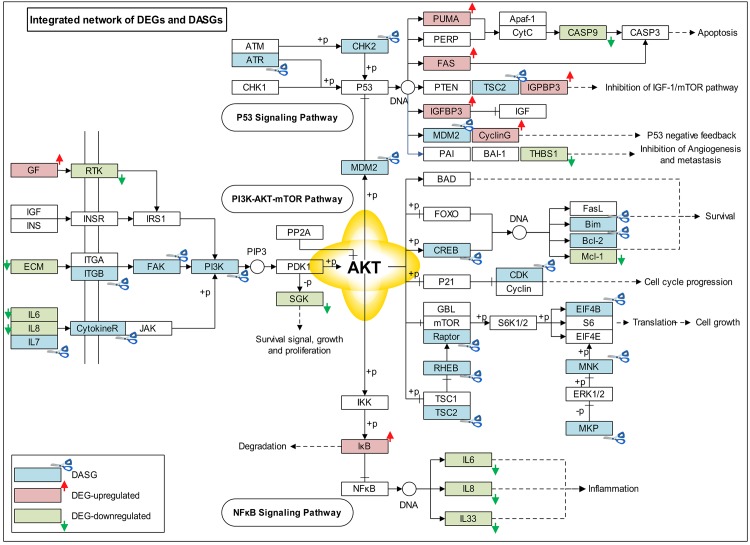
Fig 5. The integrated network affected by DEGs and DASGs.
This plot shows an integrated gene-regulation network which is built based on those KEGG pathways affected by DEGs and DASGs. In the plot, red boxes represent those DEGs which are up-regulated; the green ones represent those DEGs which are down-regulated. Those DASGs are displayed as blue-colored boxes.

