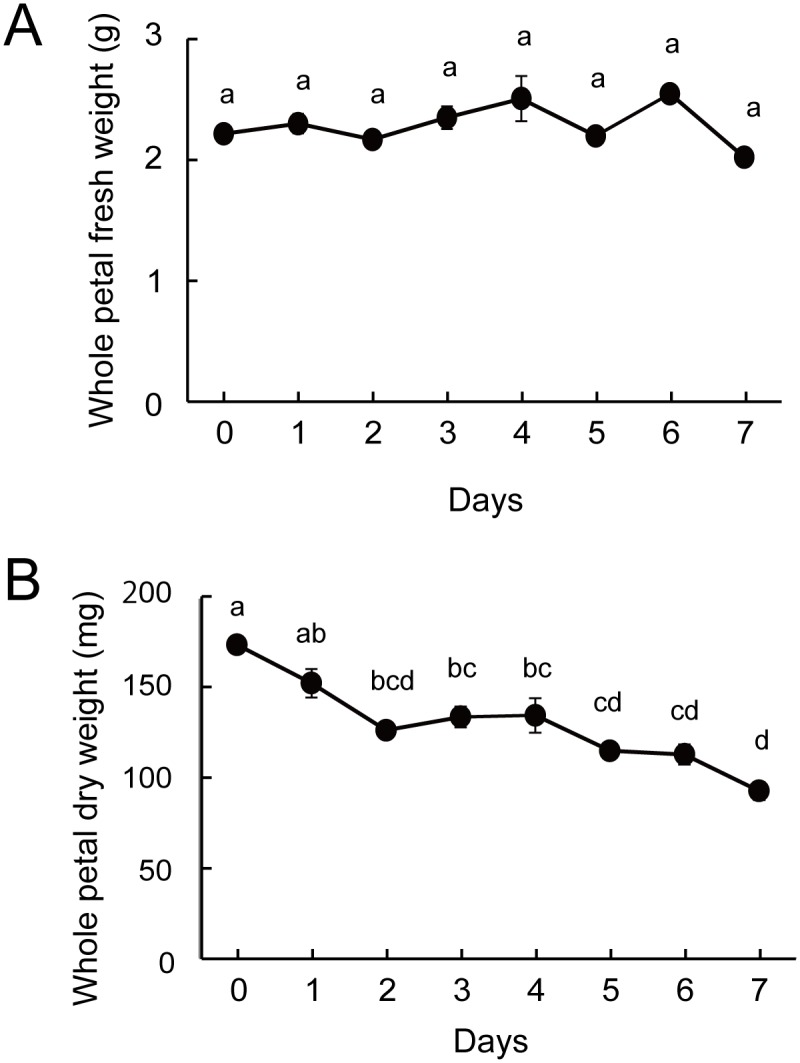
Fig 2. (A) Fresh weight and (B) dry weight of individual whole petals during flower development and senescence.

Means with different letters are significantly different (Tukey test, p < 0.05). Each data point represents the mean ± S.E. (n = 3).

Means with different letters are significantly different (Tukey test, p < 0.05). Each data point represents the mean ± S.E. (n = 3).