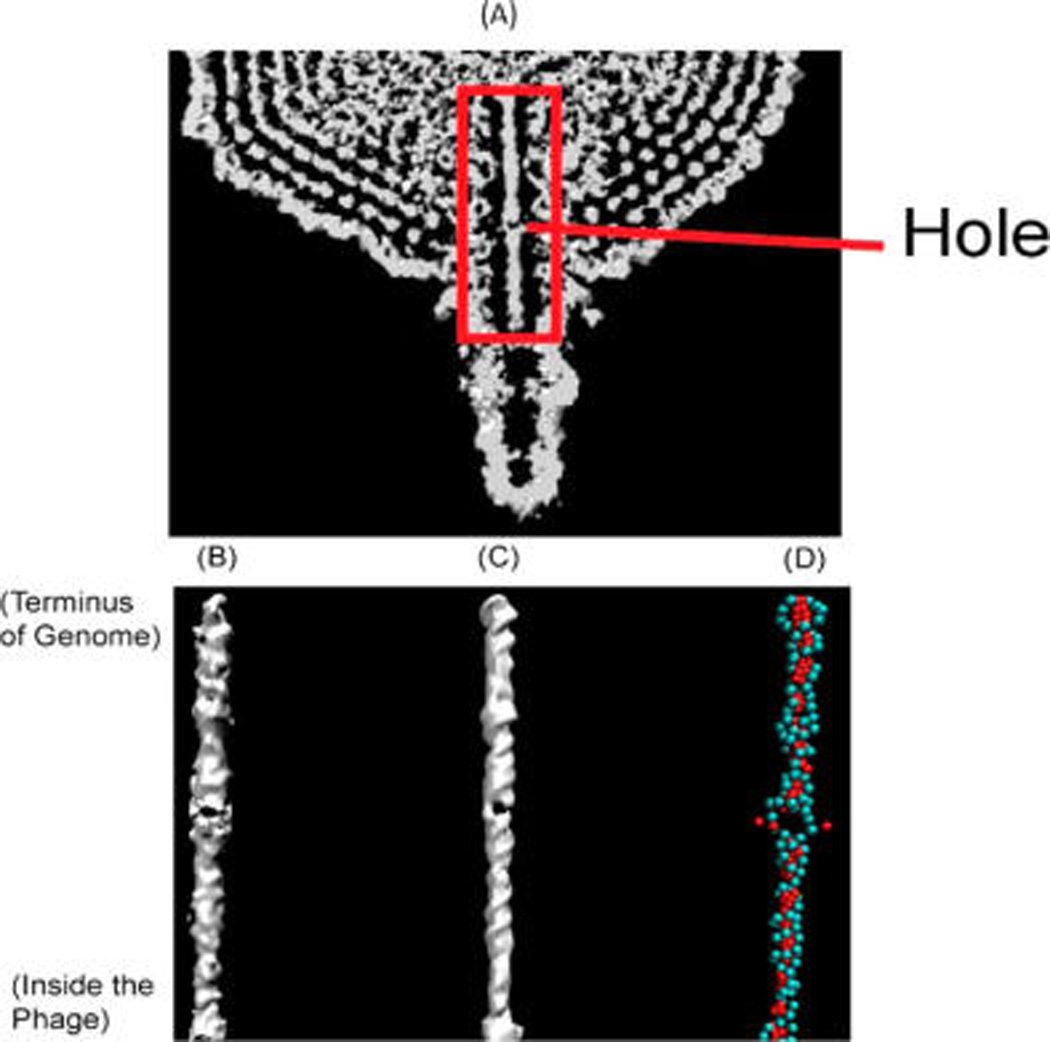
Figure 1.

Comparison of the density map between experiment and simulation. (A) Cryo-EM density map from experiment for the phage from ref 12. The red box indicates the region investigated in this work. (B) Cryo-EM density map from the experiment for DNA in the channel (ref 12). (C) Density map produced by simulation with cryo-EM fitting. (D) Snapshot of the DNA structure from a simulation. The backbone beads are represented in cyan, and the base beads are red.
