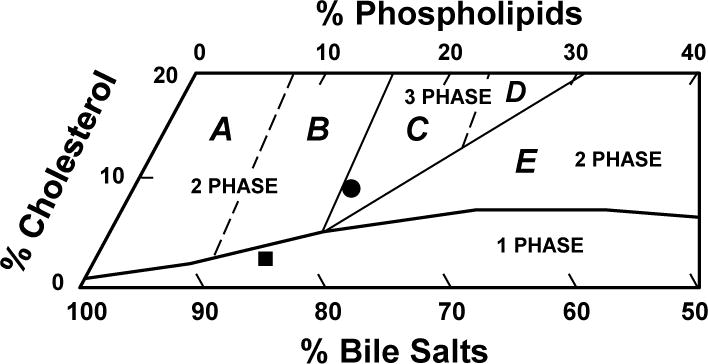
Figure 2.

The relative biliary lipid composition (moles per 100 moles) of pooled gallbladder bile (n=10 per group) is plotted on a condensed phase diagram according to average total lipid concentration (~10.0 g/dL) of the bile (see Table 1). One-phase micellar zone is enclosed by a solid curved line. Above it, two solid and two dashed lines divide the phase diagram into Regions A–E with different crystallization sequences. The relative biliary lipid composition of pooled gallbladder bile from mice receiving no ezetimibe and fed the lithogenic diet for 8 weeks is located in the central three-phase zone, where bile is composed of solid cholesterol monohydrate crystals, liquid crystals, and saturated micelles at equilibrium. By contrast, ezetimibe administration leads to relative biliary lipid composition of pooled gallbladder bile plotted in the one-phase micellar zone, even upon the lithogenic diet feeding for 8 weeks. By phase analysis, this bile consists of only unsaturated micelles at equilibrium. Symbols ● and ■ represent relative biliary lipid composition of pooled gallbladder bile in E2-treated OVX mice at 8 weeks on the lithogenic diet supplemented with ezetimibe at 0 and 8 mg/kg/day, respectively.
