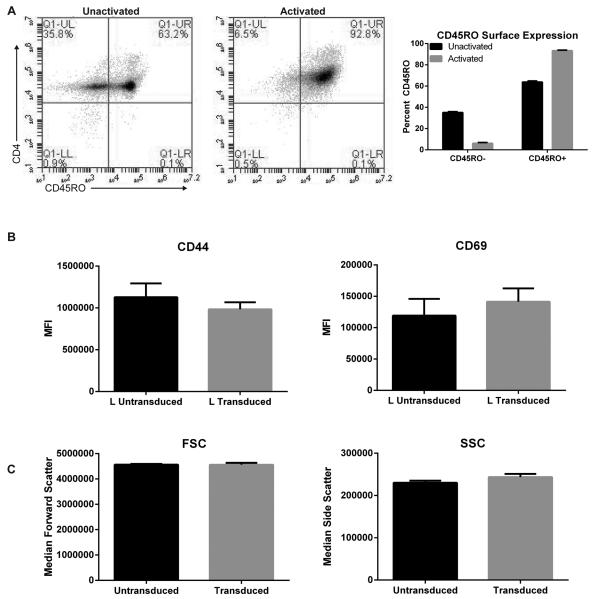
Figure 6. Primary CD4+ T cells are adequately stimulated prior to transductions & untransduced/Transduced T cells show similar levels of T cell activation markers CD44/CD69.
(A) Left: Un-activated and 6 day activated CD4+ T cells were surface stained with CD4+ and CD45RO.1 and analyzed using flow cytometry. Right: Quantification of surface CD45RO in primary human CD4+ T cells pre and post activation from two independent donors. (B) Untransduced and transduced primary CD4+ T cells were stained with surface CD44 or CD69 conjugated with Alexa-fluor 647 and then gated on the Large “L” population. Data was graphed as mean MFI ±SEM from three independent donors. (C) Median forward “FSC” and side “SSC” scatters were quantified from untransduced and transduced primary CD4+ T cells. Data was graphed as mean Median FSC/SSC ±SEM from three independent donors.

