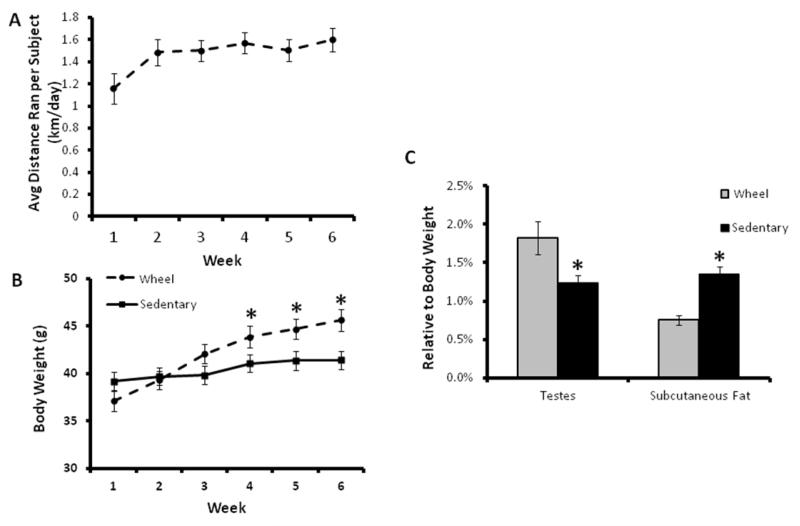
Figure 1.
(A) Average distance run per day per animal over the course of 6 weeks in the Exercise treatment. (B) Average body weight over the course of 6 weeks in each treatment, weight increased over time in the Exercise treatment only (n = 10 / group, p < 0.05). (C) Testes and subcutaneous fat weight as a percentage of body weight. Testes were significantly larger in the Exercise treatments and subcutaneous fat was significantly smaller (p < 0.05 for all comparisons). * indicates significant difference between Sedentary and Exercise conditions.

