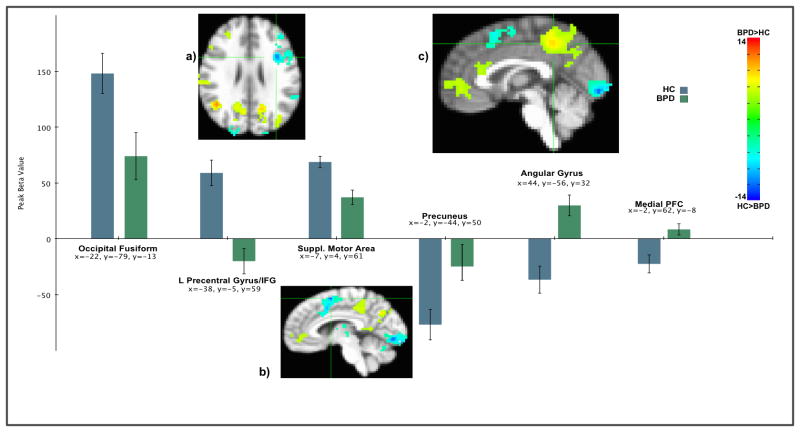
Figure 2.
Peak activation from selected clusters from BPD>control ANOVA contrast. More positive betas for the control group relative to BPD are in light blue to blue. More positive betas for the BPD group are light green to red. Areas shown are a) left Precentral/inferior frontal gyrus, b) supplemental motor area, and c) precuenous. Maps thresholded at z=4.89. Color bar refers to z-scores.

